Smadar Gertel1, Victoria Furer1, Ari Polachek1 and Ori Elkayam2, 1Tel Aviv Sourasky Medical center, Tel Aviv, Israel, 2Tel Aviv Medical Center, Tel Aviv, Israel
Background/Purpose: Psoriatic arthritis (PsA) is a chronic immune-mediated condition that results in systemic musculoskeletal (MSK) inflammation, including peripheral synovitis, enthesitis and axial involvement. Glucocorticoids (GCs) are indicated for local control of synovitis by intra articular injection. We hypothesized that GCs may promote suppressive activity through up-regulation of lymphocyte-activation gene-3 (LAG-3), a regulatory molecule that can be modulated by different drugs. In this study, we investigated the effects of GCs and other anti-rheumatic drugs on modulation of LAG-3 and of an additional regulatory molecule co-expressed with LAG-3, programmed cell death receptor-1 (PD-1), in synovial cells ex-vivo.
Methods: Synovial fluid mononuclear cells (SFMCs) derived from PsA patients were co-cultured with GCs [betamethasone (BET) and methylprednisolone acetate (MPA))], TNF inhibitor (i) (infliximab, IFX), IL-17Ai (secukinumab, SEC), IL-12/23i (ustekinumab, UST)] and methotrexate (MTX) or with medium alone for 5 days. Cells were analyzed for CD45 and LAG-3 by flow cytometry and all drugs were used in their therapeutic concentrations. To identify the drugs' impact on cell growth and regulatory molecules, total SFMCs cell growth and expression of LAG-3 and PD-1 on CD3 and CD14 cells were analyzed.
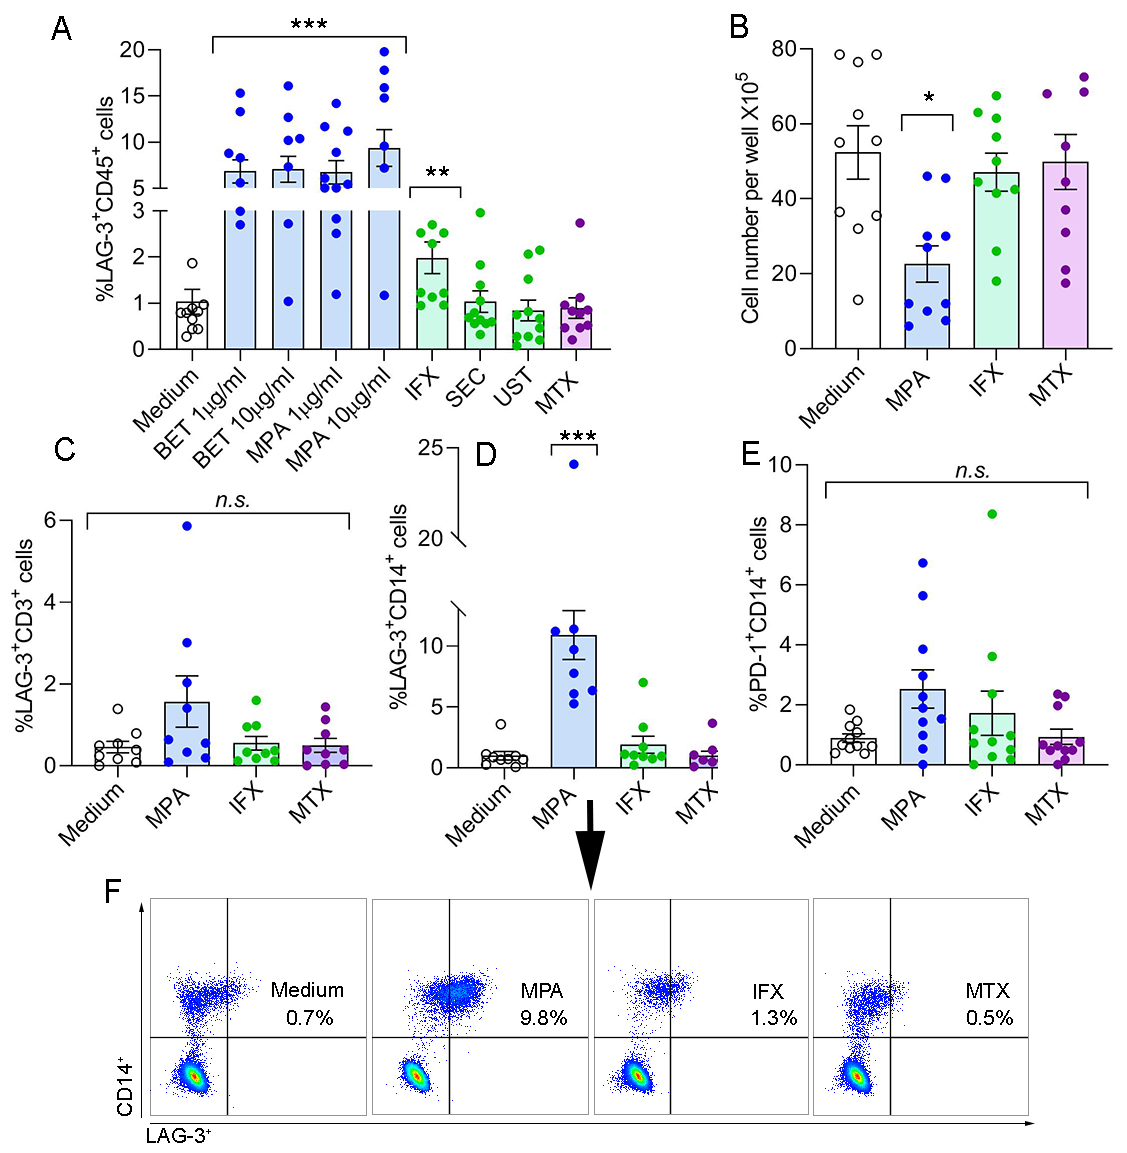
Results: SFMCs derived from 11 PsA patients co-cultured with GCs showed a significant increase in %LAG-3+CD45+ cells (BET 1mg/ml, 6.8±1.3; BET 10mg/ml, 7.1±1.4; MPA 1mg/ml, 6.7±1.3; and MPA 10mg/ml, 9.4±2.0, p< 0.001, respectively) as compared to medium (1.0±0.3). Likewise, IFX also increased this cell population (2.0±0.3, p= 0.005) as compared to the medium (1.0±0.3), but to a lesser extent than GCs. In contrast, SEC, UST, and MTX had no effect on %LAG-3+CD45+ cells as compared to the medium, (1.0±0.2, 0.8±0.2, and 0.9±0.2, respectively) (Figure 1A). GCs (MPA) and IFX reduced the total SFMCs cell count/well but this change was statistically significant only for GCs (21±5.1X10⁵/well, p< 0.01 and 41±5.1X10⁵/well, respectively), while MTX had no effect compared to the medium (49±4.8X10⁵/well and 51±5.1X10⁵/well, respectively) (Figure 1B). In the same co-culture setting, the proportion of LAG-3+CD3+ T cells was low for all experimental groups (Figure 1C), whereas %LAG-3+CD14+ monocytes were markedly up-regulated by GCs (12.8±2.1, p< 0.001) compared to the medium (0.9±0.4) (Figure 1 D and F). The proportion of PD-1+CD14+ monocyteswas not significantly increased by GCs and other drugs (Figure 1E).
Conclusion: Our data show that GCs immunosuppressive activity is mediated through up-regulation of LAG-3 in SFMCs. Within the tested anti-rheumatic drugs, this activity was exclusively mediated by GCs and to a lesser extent by a TNF inhibitor. GCs reduced the total SFMCs cell growth in culture and concomitantly up-regulated LAG-3, mainly on monocytes. This study proposes that synovial monocytes expressing LAG-3 are potential mediators of the GCs immunosuppressive effect. Further investigation into the precise involvement of LAG-3 in inhibition of synovial inflammation is required.
Figure 1. GCs and to a lesser extent TNF inhibitor up-regulate LAG-3 in SFMCs ex-vivo. (A) SFMCs derived from PsA patients (n=11) were cultured ex-vivo with betamethasone (BET), methylprednisolone acetate (MPA), infliximab (IFX), secukinumab (SEC), ustekinumab (UST), and methotrexate (MTX) and analyzed for %LAG-3+CD45+ cells using flow cytometry. (B) Total SFMCs cell count/well analysis was performed after 5 days in culture with the indicated drugs: MPA, IFX and MTX. In same co-culture setting: (C) %LAG-3+CD3+, (D) %+LAG-3+CD14+ and (E) %PD-1+CD14+ cells were analyzed using flow cytometry (F) Representative images of SFMCs derived from PsA patient stained for CD14 and LAG-3 after 5 days in culture with medium or with the therapeutics indicated. Positive staining is presented in the right upper quadrant of each plot with the percentage indicated. Statistical analysis calculated by the non-parametric one-way ANOVA Kruskal-Wallis test and Dunn's multiple comparison test, *p < 0.01, **p < 0.005, ***p < 0.001, n.s., non-significant.
S. Gertel: None; V. Furer: None; A. Polachek: None; O. Elkayam: None.