Session: (1734–1775) RA – Etiology and Pathogenesis Poster
1737: ACPA, Anti-CarP and AAPA Can Be Detected in Saliva, but Not in Feces of Seropositive Rheumatoid Arthritis Patients – Support for Mucosal Involvement in Specific Locations in RA
Leiden University Medical Center Rotterdam, Netherlands
Disclosure information not submitted.
Veerle Derksen1, Klara Martinsson2, René Toes1, Daniel Sjöberg3, Thomas Huizinga1, Alf Kastbom4, Anna Svärd3 and Diane van der Woude1, 1Leiden University Medical Center, Leiden, Netherlands, 2Linköping University, Linköping, Sweden, 3Centre for Clinical Research Dalarna, Uppsala, Sweden, 4Linköping University, Stockholm, Sweden
Background/Purpose: Rheumatoid arthritis (RA) patients harbor antibodies against several post-translational modifications (AMPA), for example anti-citrullinated protein antibodies (ACPA), anti-carbamylated antibodies (anti-CarP) and anti-acetylated protein antibodies (AAPA). The exact mechanism underlying the development of these autoantibodies is currently unclear. Remarkably, ACPA IgA have been detected in sputum and saliva of seropositive RA patients, suggesting local production of autoantibodies. This raises two questions: 1) Can other AMPA besides ACPA also be produced at mucosal surfaces and 2) Which mucosal sites can be involved in AMPA production? The intestines are an interesting site to investigate, as microbiome dysbiosis has been described in RA patients, and intestinal content may represent a source of post-translationally modified antigens which could trigger autoantibody formation.
Methods: Paired feces, saliva and serum samples of 36 ACPA IgG-positive RA patients, 11 ACPA IgG-negative RA patients and 21 healthy volunteers were collected. Saliva was collected via passive drooling. Feces was self-collected by participants and immediately frozen. To substantiate our findings regarding the lower intestinal tract, ileal wash fluid samples were used of 20 ACPA IgG-positive RA patients and 10 healthy donors, collected in an independent cohortvia colonoscopy. All patients fulfilled the ACR/EULAR 2010 criteria. Total IgA, anti-E. Coli IgA and ACPA, anti-CarP and AAPA IgA (serum, saliva) or Ig (feces) were detected using in-house ELISA. Samples were considered AMPA positive when the value of the modified peptide was above the cut-off (mean + 2 times SD of healthy donors) and the signal measured on the modified peptide was >2 times higher than on the unmodified peptide.
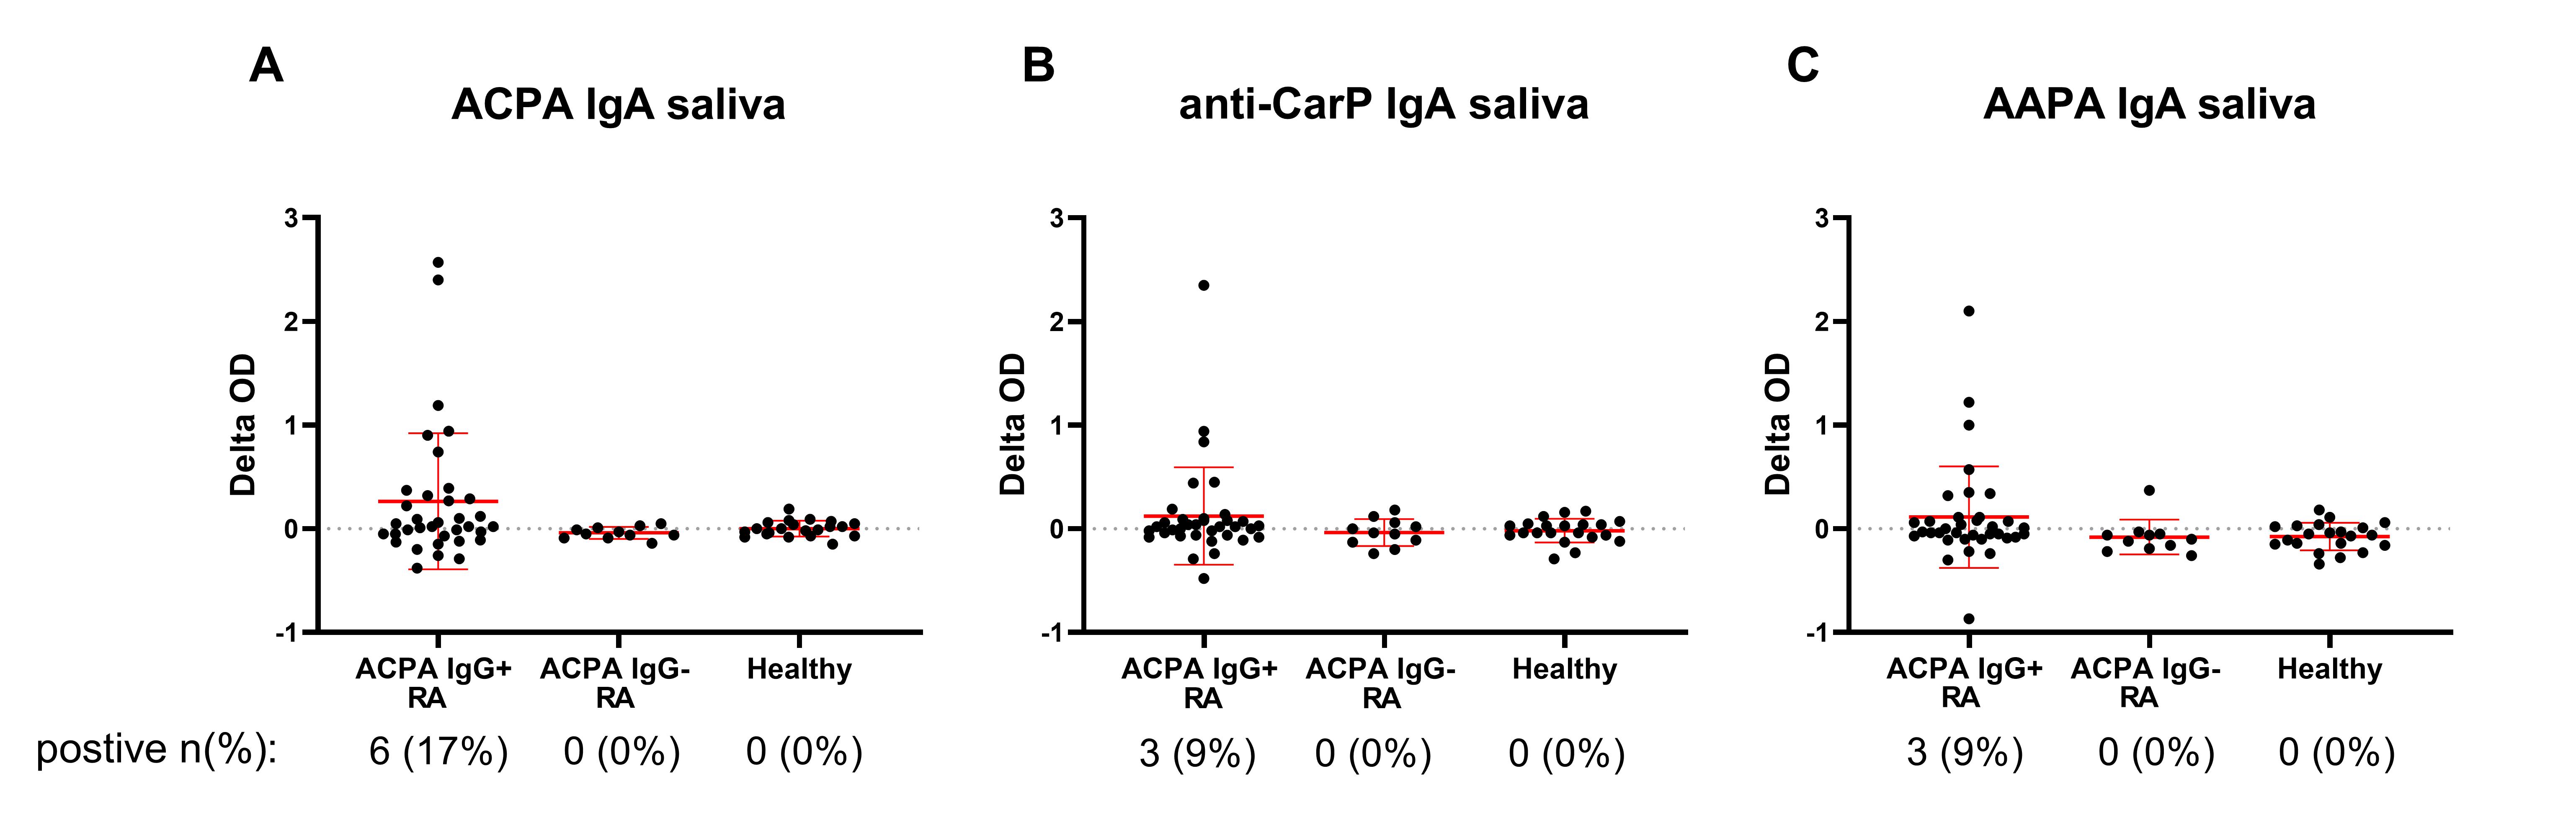
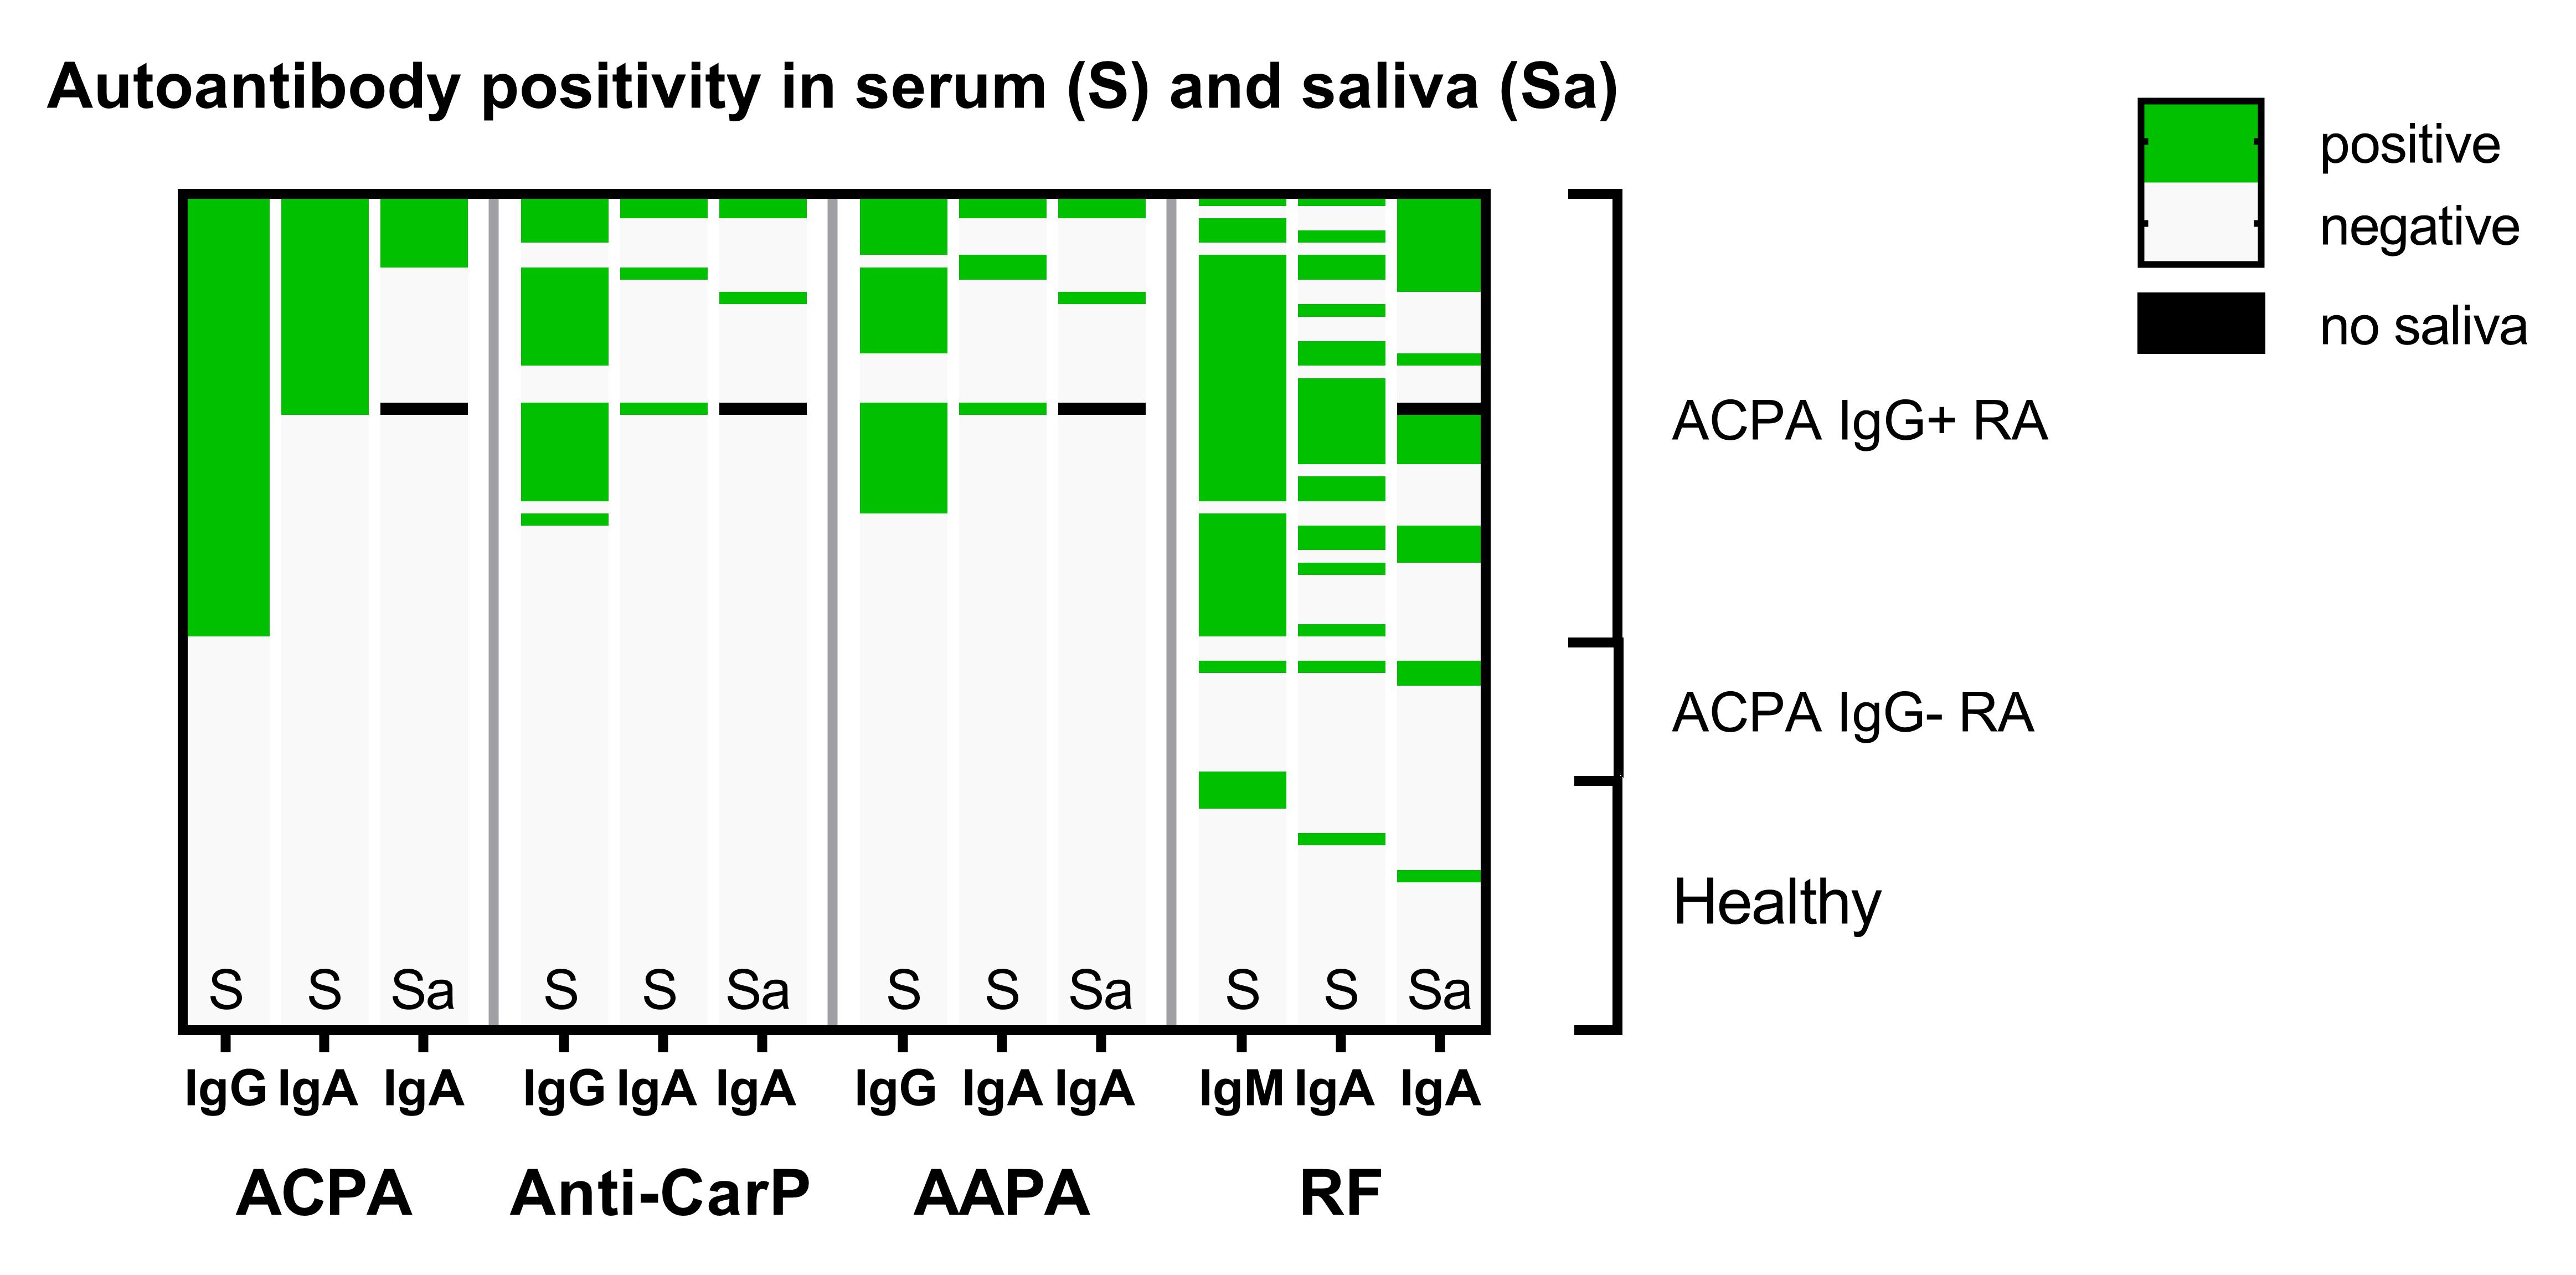
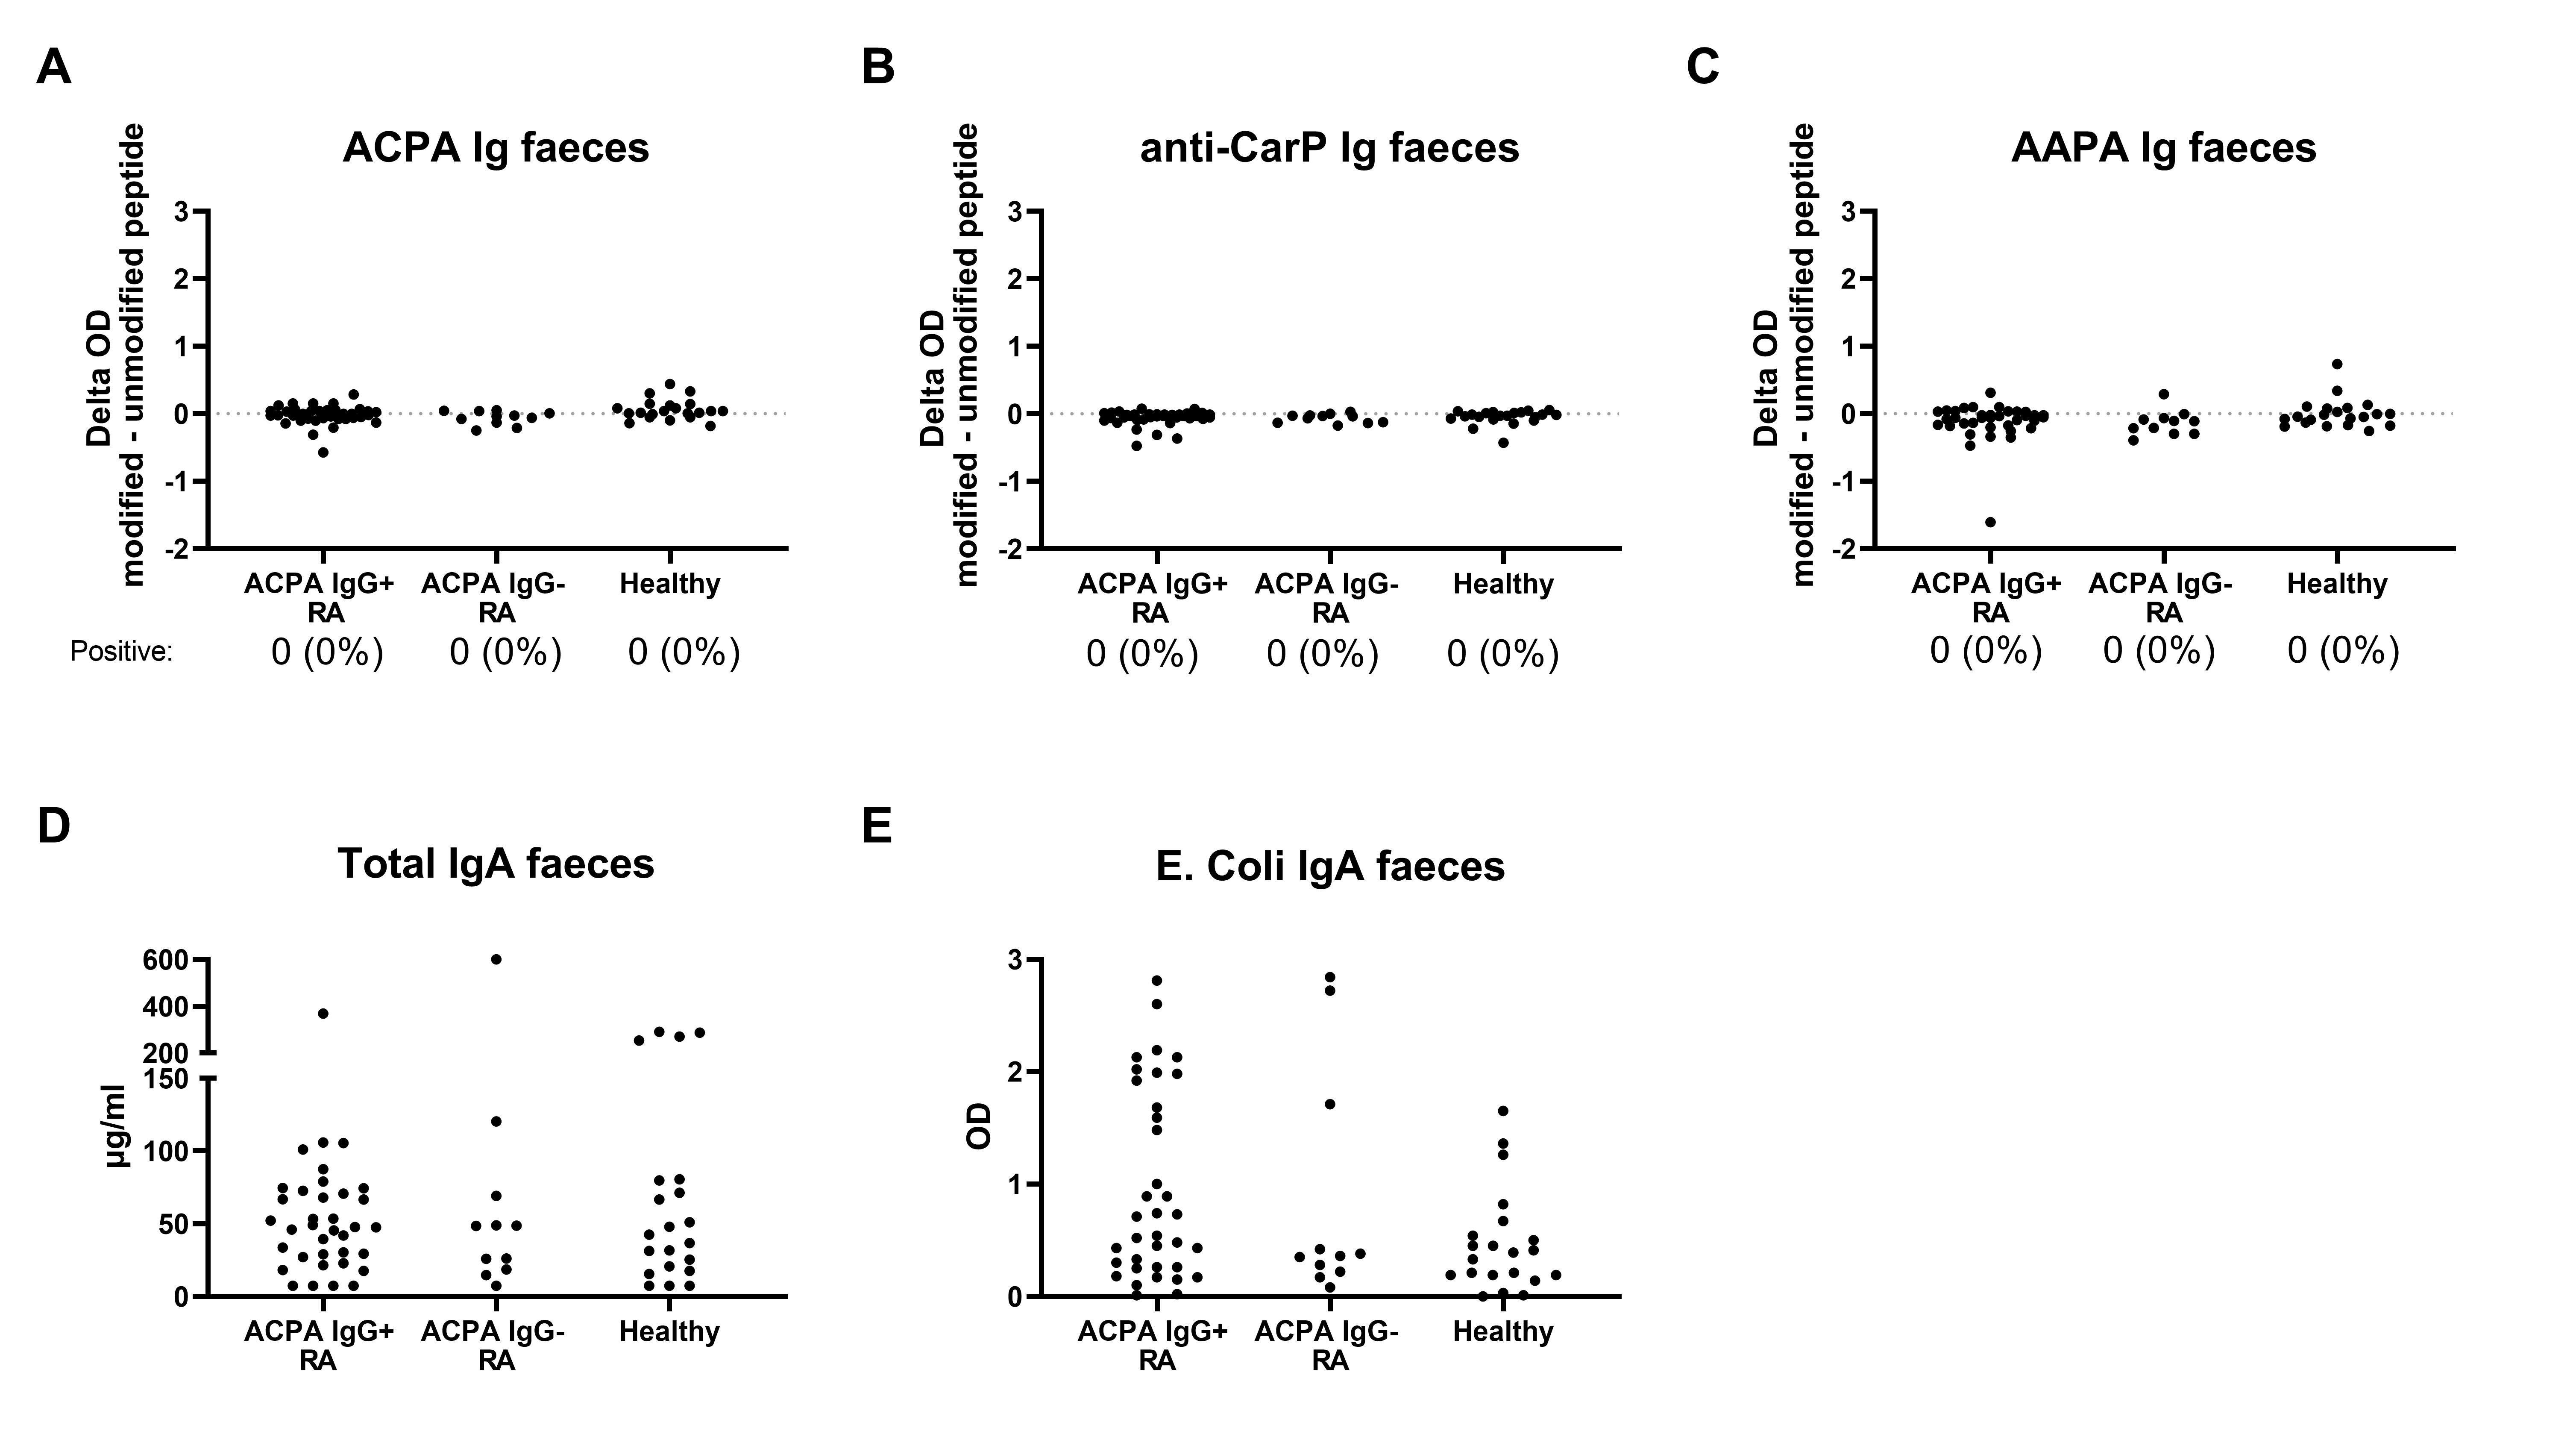
Results: ACPA, anti-CarP and AAPA IgA can all be detected in saliva of seropositive RA patients with differences in optical density (OD) between the modified and the unmodified peptide being clearly higher than in ACPA-negative patients and healthy controls, although the number of positive patients was low (Figure 1). When present, the saliva autoantibody profile reflects the breadth of the serum autoantibody response (Figure 2). However, AMPA Ig could not be detected in any of the fecal supernatants (Figure 3). Also in the ileal wash fluid samples no ACPA was found. Even in ACPA-positive RA patients OD-differences between the modified and unmodified peptide were consistently close to 0. Other intact IgA was present in feces, since the samples contained on average 76 μg/ml total IgA and anti-E.Coli IgA was detectable in feces of 12/36 ACPA-positive RA patients (Figure 3).
Conclusion: ACPA, anti-CarP and AAPA can all be present in saliva of ACPA-positive RA patients. However, AMPA could not be detected in feces of these patients. Also in ileal wash fluid, collected in an independent cohort of ACPA-positive RA patients, no ACPA was present. Other (antigen-specific) antibodies were present in feces, indicating that the absence of an AMPA signal is not due to methodological issues. These findings suggest that the lower gastro-intestinal tract is not a main site of AMPA production in RA patients, but the oral mucosa might play a role in the AMPA response.
Figure 1: Autoantibody measurements in saliva. Delta OD (optical density): difference in OD between the modified peptide and the unmodified peptide. The groups on the X-axis are based on seropositivity. The number (%) of positive patients for that specific autoantibody is given. Red bars depict mean with standard deviation.
Figure 2: Positivity for the different AMPA in serum (S) and saliva (Sa). Each row depicts a study participant. The black box means no saliva available due to hyposalivation.
Figure 3: AMPA in feces of RA patients. A-C) ACPA, anti-CarP and AAPA Ig respectively. The groups on the X-axis are based on seropositivity. For AMPA, the number (%) of positive patients is given. On the Y-axis the difference in OD between the modified and unmodified peptide is depicted. D) Total IgA levels in µg/ml, E) OD on the anti-E. Coli IgA ELISA in the same feces samples.
V. Derksen: None; K. Martinsson: None; R. Toes: Bristol-Myers Squibb(BMS), 5; D. Sjöberg: None; T. Huizinga: None; A. Kastbom: None; A. Svärd: None; D. van der Woude: None.