Boston Children's Hospital Boston, MA, United States
Disclosure information not submitted.
Claudia Harris1, Maria Taylor2, Ki Pui Lam2, Indu Raman3, Chengsong Zhu3, Pui Lee1, Peter Nigrovic4, Erin Janssen5, Jing Cui6 and Lauren Henderson4, 1Division of Immunology, Boston Children's Hospital, Boston, MA, 2Division of Immunology, Boston Children’s Hospital, Boston, MA, 3Department of Immunology, Microarray & Immune Phenotyping Core Facility, University of Texas, Southwestern Medical Center, Dallas, TX, 4Boston Children's Hospital, Boston, MA, 5Department of Pediatrics, Michigan Medicine, Ann Arbor, MI, 6Brigham and Women's Hospital, Boston, MA
Background/Purpose: A subset of children with oligoarticular juvenile idiopathic arthritis (oligo JIA) who are anti-nuclear antibody (ANA) positive are known to have dysregulated T cell-B cell interactions in affected joints. In these patients, clonally expanded T peripheral helper (Tph) cells are enriched in the synovial fluid (SF), overexpress factors associated with B cell help, and promote the differentiation of antibody-producing plasmablasts. To further evaluate B cell responses in oligo JIA, we characterized the autoantibody profile of these patients.
Methods: Paired blood and SF samples were obtained from oligo JIA patients, defined by ILAR criteria. Blood samples were also collected from pediatric controls. Plasma and SF supernatant were inputted into an autoantigen microarray platform to screen for 120 IgG and IgA autoantibodies. The net fluorescence intensity (NFI) for each antigen was calculated by subtracting the background signal. The NFI was normalized to control antibodies spiked into the arrays. Autoantigens with low signal-to-noise ratio (SNR) were excluded. The autoantibody score (Ab-score) for each autoantigen was generated by a log2 transformation using NFI and SNR. Oligo JIA patients were stratified into 3 groups based on age of disease onset and ANA status: ≤6 years, ANA+; ≤6 years, ANA-; and >6 years. ANOVA with correction for multiple comparisons was used to compare the Ab-score for each autoantigen across the study groups. R was used to generate heat maps, and statistical analysis software (SAS) was used for the statistical analysis.
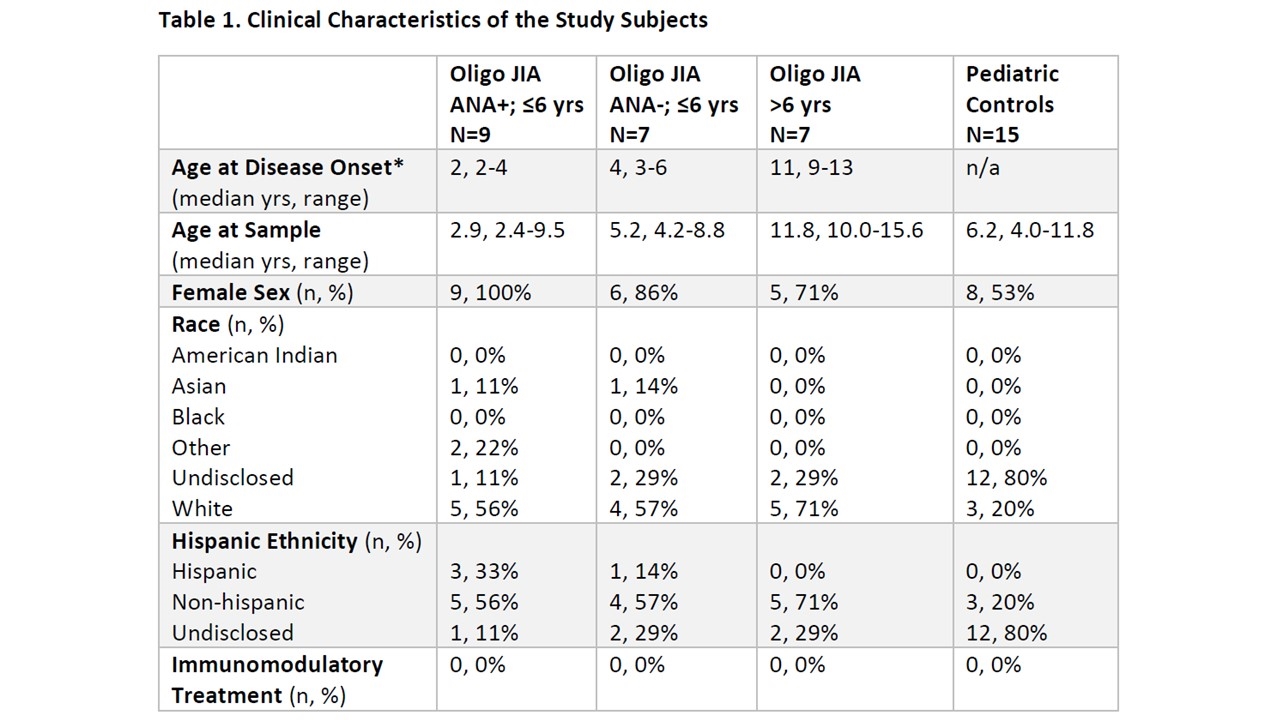
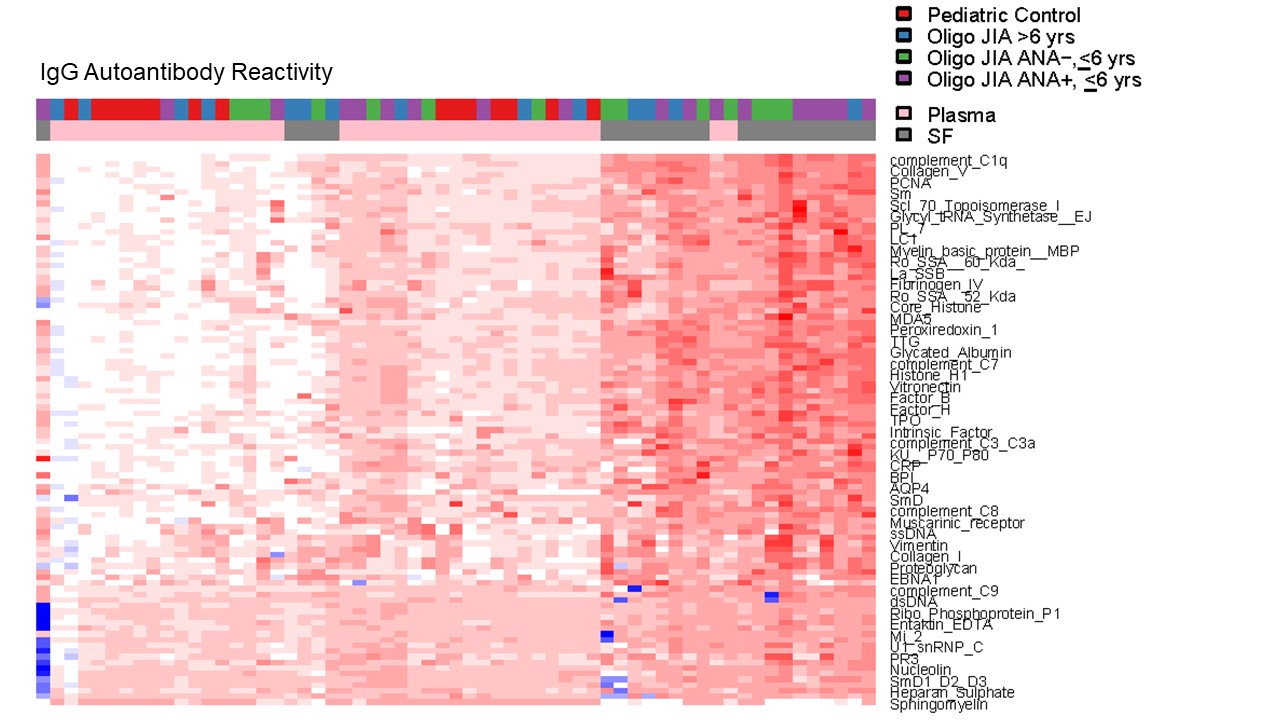
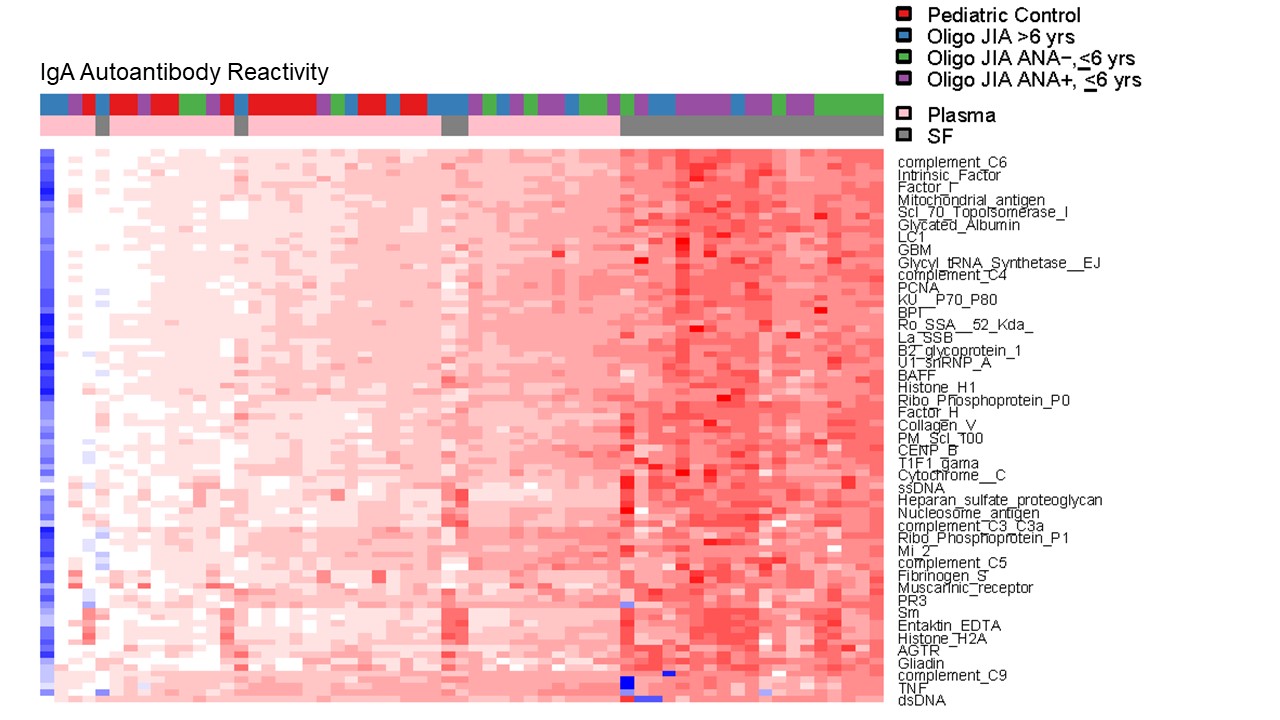
Results: 23 oligo JIA and 15 pediatric controls were studied (Table 1). After quality control, results from 97 and 88 autoantigens on the IgG and IgA arrays, respectively, were retained for analysis. Compared to the plasma of controls, 57 IgG and 49 IgA autoantibodies were significantly elevated in the SF of all 3 strata of oligo JIA patients. An additional 19 IgG and 32 IgA autoantibodies were significantly increased in the SF of oligo JIA patients with disease onset ≤6 years, regardless of ANA status. Fewer autoantibodies were significantly elevated in oligo JIA plasma vs. control plasma (14 IgG; 8 IgA autoantibodies), most in the ≤6 year groups. After setting a false discovery rate (FDR) of 5% to account for testing multiple autoantigens, 72 IgG and 82 IgA autoantibodies remained significantly different across the study groups. Heat maps showed that autoantibody reactivity was highest in the SF of children with early-onset disease (Figures 1-2). Directly comparing oligo JIA patients with disease onset ≤6 years (regardless of ANA status) to those who were older at initial presentation confirmed that all differentially expressed autoantibodies were higher in the patients with early-onset disease (35 IgG; 53 IgA autoantibodies in SF and 8 IgG; 36 IgA autoantibodies in plasma).
Conclusion: A broad array of autoantibodies were detected in the SF of oligo JIA patients. Early age at disease onset, not ANA status, was the factor most associated with the high levels of autoantibodies in SF. These findings suggest that dysregulated B cell responses in the arthritic joint are particularly prominent in oligo JIA patients who develop disease at a young age.
*Age patient/family reported onset of symptoms, rounded to the nearest year. Oligo JIA, oligoarticular juvenile idiopathic arthritis; ANA, anti-nuclear antibody; yrs, years; n/a, not available
Figure 1. Heat map showing IgG Autoantibody Reactivity. Plasma and SF samples from pediatric controls and oligo JIA patients were evaluated with an autoantigen microarray. The most differentially expressed autoantibodies are depicted in the heat map. The color represents distance in standard deviations from the mean of the controls with red indicating an increase in reactivity above controls and blue indicating a decrease in reactivity compared to controls. Oligo JIA, oligoarticular juvenile idiopathic arthritis; ANA, anti-nuclear antibody; yrs, years
Figure 2. Heat map showing IgA Autoantibody Reactivity. Plasma and SF samples from pediatric controls and oligo JIA patients were evaluated with an autoantigen microarray. The most differentially expressed autoantibodies are depicted in the heat map. The color represents distance in standard deviations from the mean of the controls with red indicating an increase in reactivity above controls and blue indicating a decrease in reactivity compared to controls. Oligo JIA, oligoarticular juvenile idiopathic arthritis; ANA, anti-nuclear antibody; yrs, years
C. Harris: None; M. Taylor: None; K. Lam: None; I. Raman: None; C. Zhu: None; P. Lee: None; P. Nigrovic: None; E. Janssen: None; J. Cui: None; L. Henderson: Adaptive Biotechnologies, 2, 5, Bristol-Myers Squibb(BMS), 5, Pfizer, 2, Sobi, 1, 2, 5.