Kyunghee university at Gangdong Gangdong-gu, Seoul, South Korea
Disclosure information not submitted.
Hong Ki Min1, Se Hee Kim2, Hae-Rim Kim3, Sang-Heon Lee1 and Sang-Hoon Lee2, 1Konkuk University School of Medicine, Seoul, South Korea, 2Kyung Hee University Hospital at Gangdong, Seoul, South Korea, 3Rheumatology, Konkuk University Medical Center, Seoul, South Korea
Background/Purpose: Costotransverse joint ankylosis in radiographic axial spondyloarthritis (r-axSpA) patients was measured. Furthermore, the association between syndesmophyte progression assessed by CT syndesmophyte score (CTSS) and facet, costovertebral, and costotransverse joints ankylosis were evaluated.
Methods: Whole spine CT images taken at baseline and at 2-year follow-up were used to calculate the CTSS of vertebral body. In addition, ankylosis of the facet/costovertebral/costotransverse joints was scored. CTSS (range, 0–552) and facet joint ankylosis (range, 0–46) were assessed at 23 vertebral units. Costovertebral joints at T1–T12 (range, 0–48) and costotransverse joints at T1–T10 (range, 0–20) were also assessed. Intraclass correlation coefficients (ICC) were calculated to determine inter-reader reliability. Odds ratios (OR) was calculated to identify associations between syndesmophyte progression and baseline status of other joints.
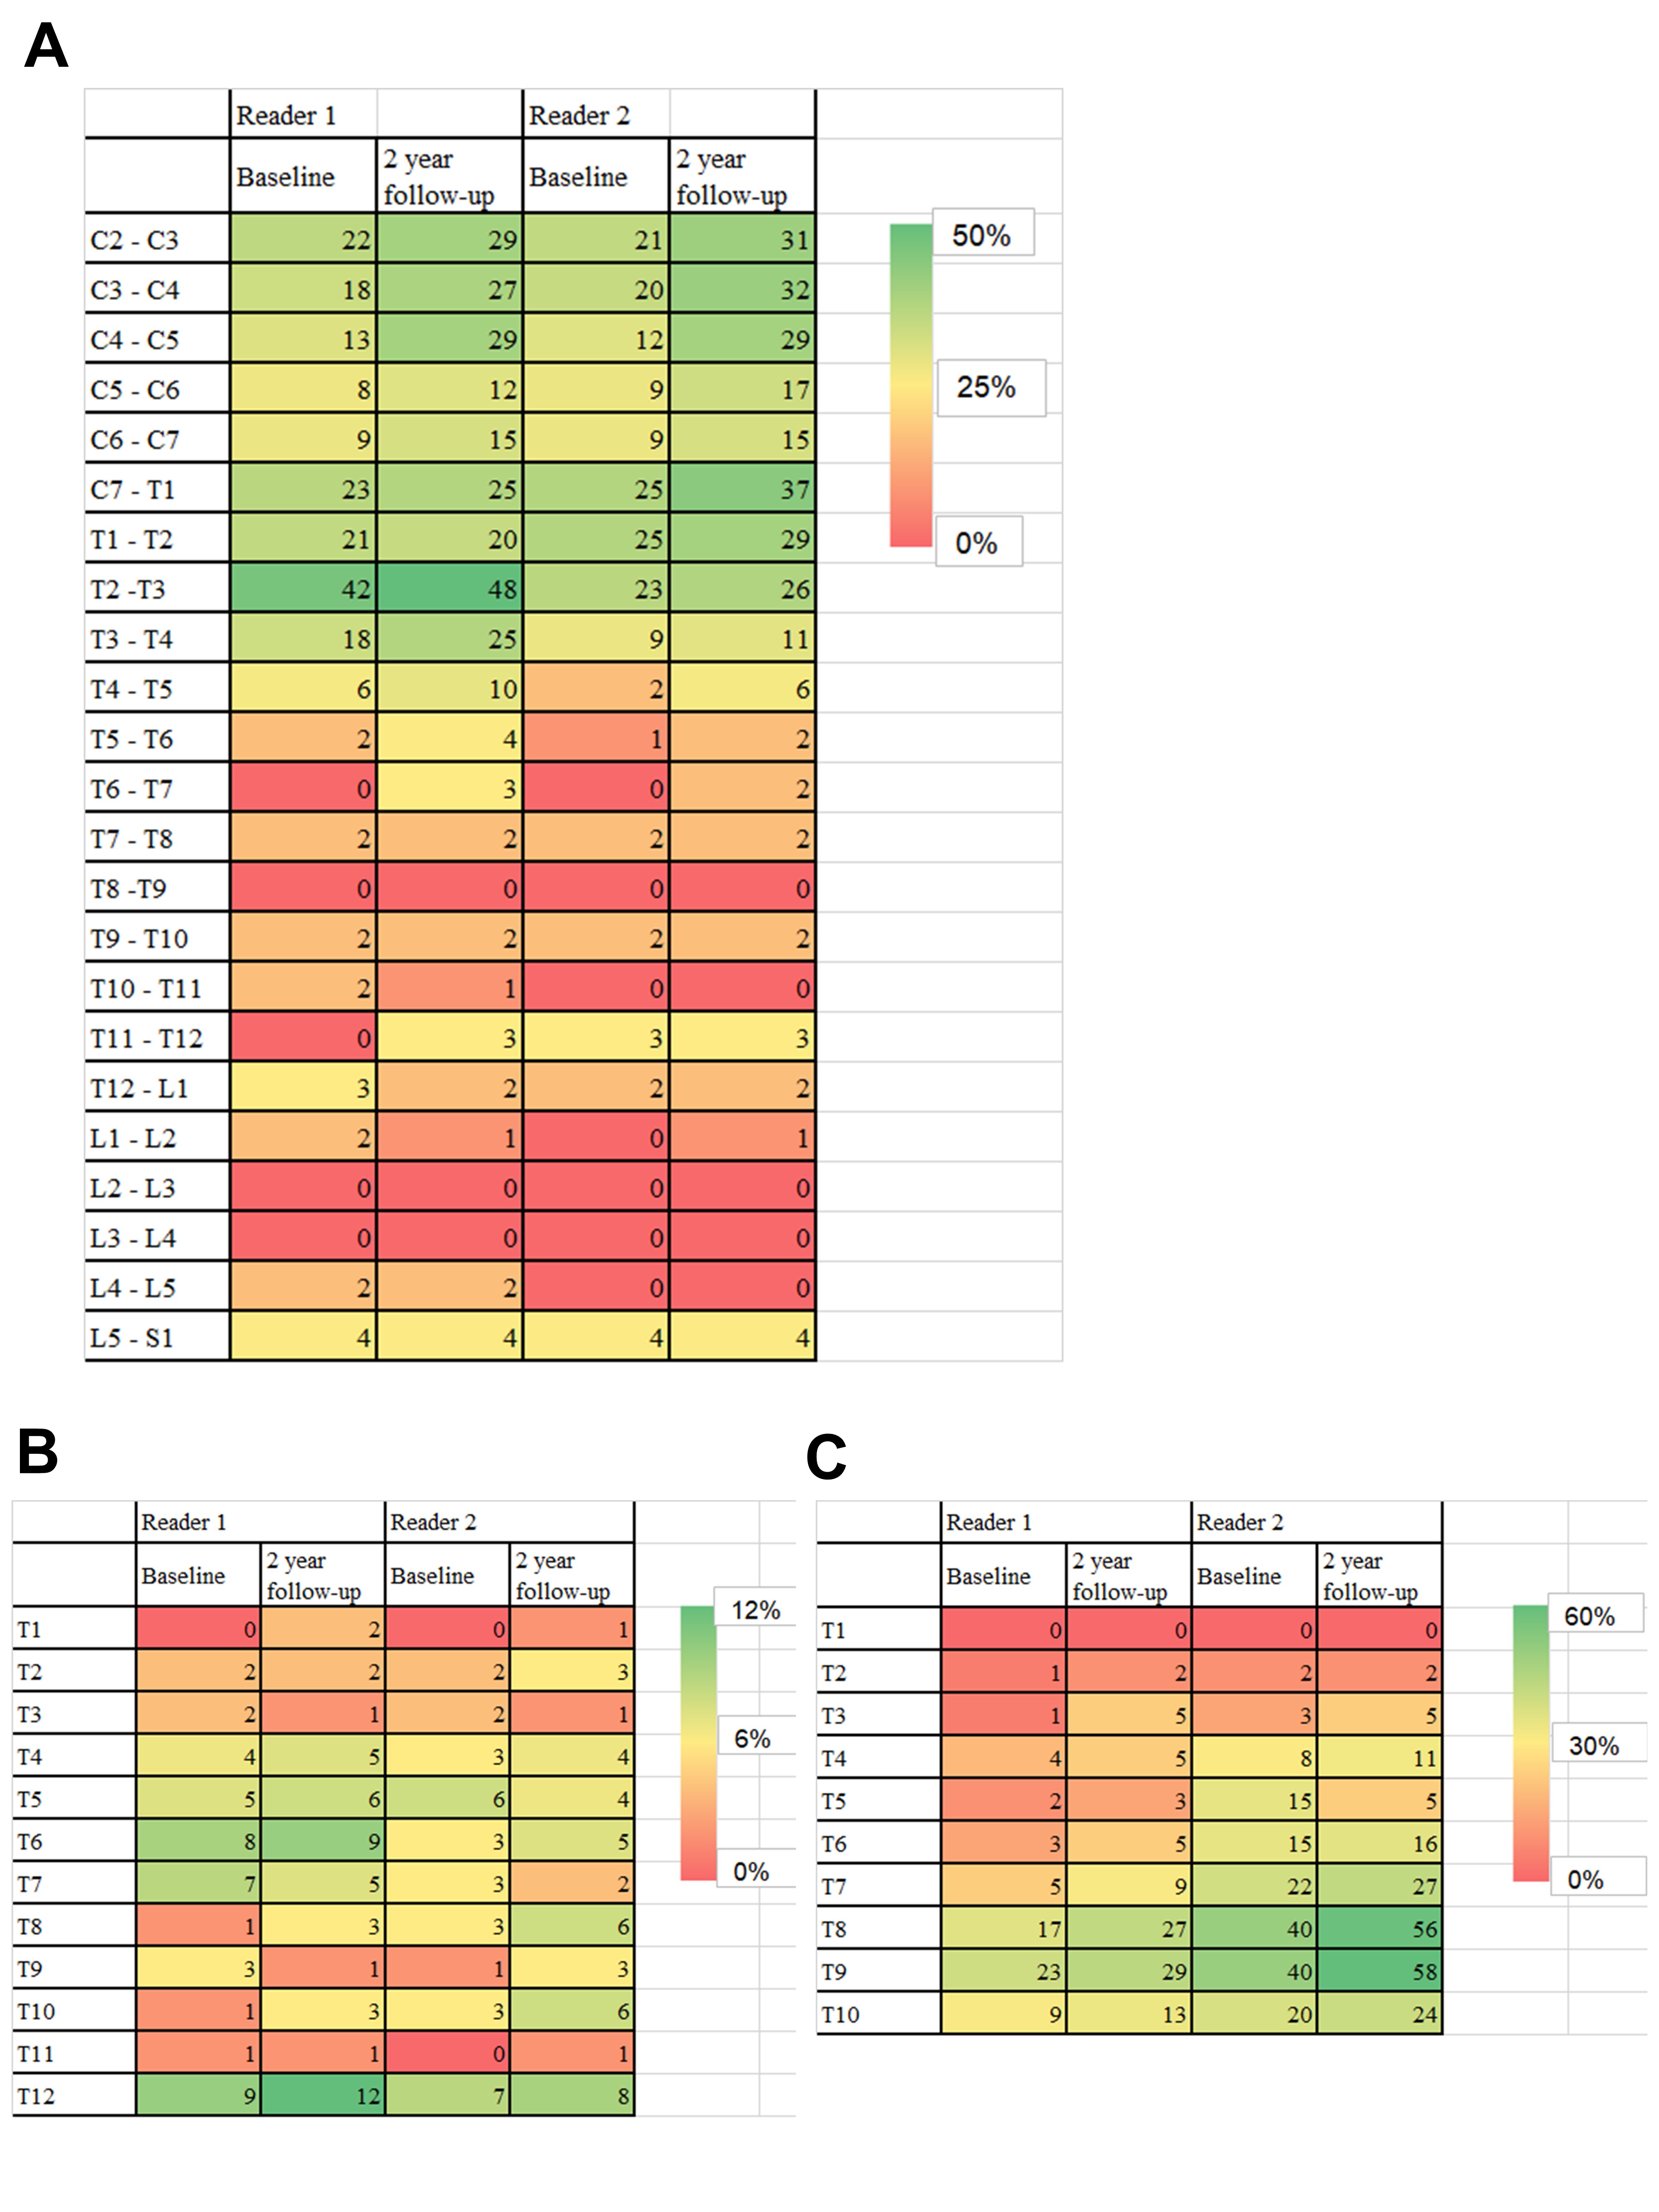
Results: Fifty patients with r-axSpA were included. Reader 1 identified C7–T3 (facet joints), T5–T7 and T12 (costovertebral joints), and T8–T9 (costotransverse joints), as common sites of ankylosis at baseline and at 2-year follow-up. The ICCs for facet, costovertebral, and costotransverse joints at baseline were 0.876 (95% confidence interval [CI] 0.782–0.930), 0.952 (95% CI, 0.915–0.973), and 0.753 (95% CI, 0.564–0.860), respectively. Multivariate logistic regression analysis revealed that the OR of baseline costovertebral and costotransverse joint ankylosis for predicting CTSS progression was 4.644 (95% CI, 2.295–9.398) and 1.524 (95% CI, 1.036–2.244), respectively.
Conclusion: Costotransverse joint ankylosis in r-axSpA patients can be measured semi-quantitatively on whole spine CT, and ankylosis of the costotransverse joints predicts progression of syndesmophytes.
Distribution of ankylosed facet joints (A), costovertebral joints (B), and costotransverse joints (C) at baseline and at the 2 year follow-up (the number inside each cell is a percentage).
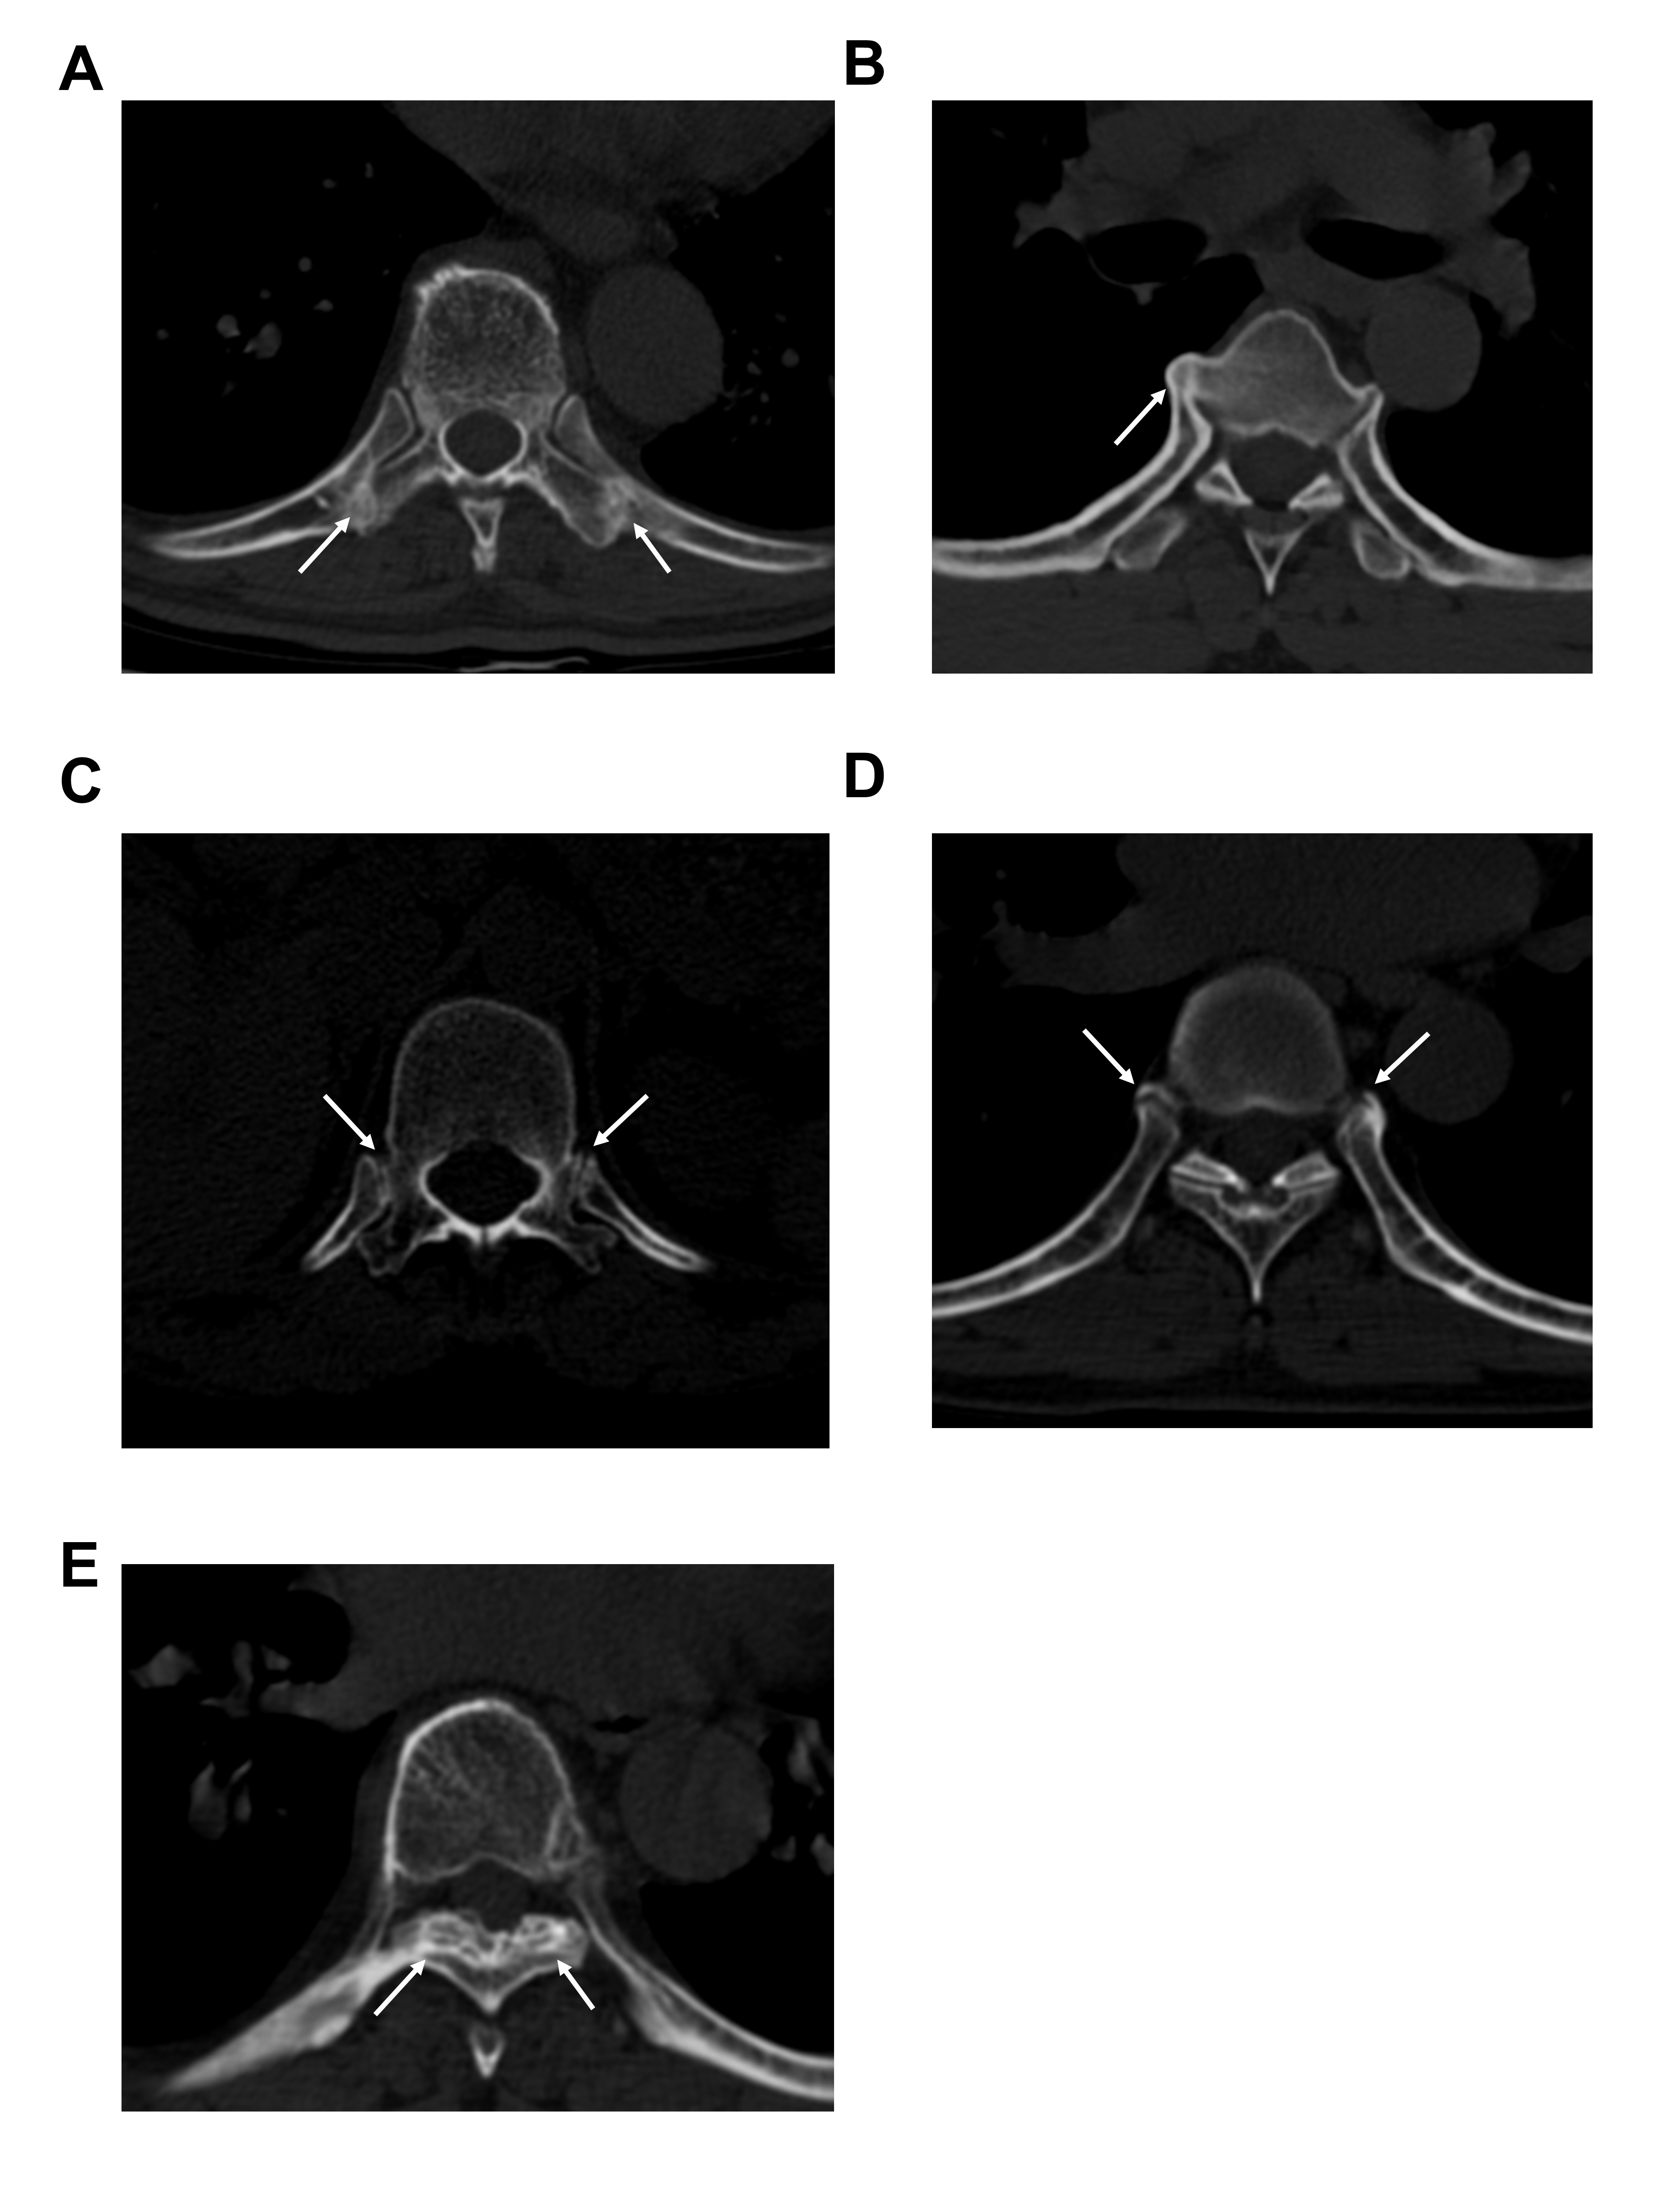
Representative CT images showing costotransverse, costovertebral, and facet joint abnormalities. (A) Bilateral ankylosis of costotransverse joints (white arrow), (B) ankylosis of costovertebral joints on the right side (white arrow), (C) erosion of the bilateral costovertebral joints (white arrow), (D) syndesmophytes on the bilateral costovertebral joints (white arrow), (E) bilateral facet joint ankylosis.
H. Min: None; S. Kim: None; H. Kim: None; S. Lee: None; S. Lee: None.