Samsung Changwon Hospital Changwon-si, South Korea
Disclosure information not submitted.
Jiwon Hwang1, Mi Yeon Lee2, Yeonghee Eun3 and Joong Kyong Ahn3, 1Division of Rheumatology, Department of Internal Medicine, Samsung Changwon Hospital, Sungkyunkwan University School of Medicine, Changwon-si, South Korea, 2Division of Biostatistics, Department of R&D Management, Kangbuk Samsung Hospital, Sungkyunkwan University School of Medicine, Seoul, South Korea, 3Division of Rheumatology, Department of Internal Medicine, Kangbuk Samsung Hospital, Sungkyunkwan University School of Medicine, Seoul, South Korea
Background/Purpose: Obesity has a well-known relationship with higher serum uric acid (SUA) levels. Skeletal muscles are another site for producing uric acid as the endogenous pool of purine. However, the actual influence of muscle mass on SUA levels was occasionally investigated.The study aimed to evaluate the impact of changing body components on SUA levels in a large number of Korean healthy populations.
Methods: We investigated 39,505 examinees from health check-up programs between 2015 and 2017. Analysis was separately conducted in men (n = 24,623) and pre- and post-menopausal women (n = 14,810 and n = 702, respectively). Body components including waist-hip ratio (WHR) were assessed using the bioimpedance method. We adopted skeletal muscle mass index (SMI) and fat mass index (FMI) based on body weight (kg). Each study population was categorized into seven groups according to the changes of body components over two years as tertiles of increase and decrease: T3 (the most), T2, and T1 (the least) of increase, no change, and T3 (the most), T2, and T1 (the least) of decrease. Hyperuricemia was defined as SUA ≥ 7mg/dL in men and SUA ≥ 6 mg/dL in women. We analyzed odds ratios (ORs) for achieving the target SUA level (< 6mg/dL) and coefficients for the association with SUA level according to the changes in body components over two years.
Results: The mean age was 38.6 ± 6.5 years in men, 37.2 ± 5.4 years in premenopausal women, and 46.1 ± 8.2 years in postmenopausal women. The mean SUA level was 6.25 ± 1.21 mg/dL in men, 4.23 ± 0.88 mg/dL in premenopausal women, and 4.34 ± 0.91 mg/dL in postmenopausal women. Hyperuricemia was most common in men (26.08%), followed by postmenopausal women (4.42%) and premenopausal women (3.22%). Over two years, the change in muscle mass was mostly within ± 2.5kg and muscle mass decreased more frequently than increased in both men and women. The impact of SMI seemed dose-dependent; the ORs (95% CI) of target attainment for T1, T2, and T3 of SMI increase were 1.10 (1.00-1.20), 1.10 (1.01-1.21), and 1.45 (1.32-1.59) in men and 1.16 (0.82-1.65), 1.48 (1.02-2.15), and 1.48 (1.06-2.06) in premenopausal women whereas the ORs for T1, T2, and T3 of SMI decrease were 1.02 (0.93-1.12), 0.92 (0.84-1.00), and 0.85 (0.77-0.93) in men and 1.18 (0.84-1.65), 0.73 (0.55-0.98), and 0.67 (0.51-0.88) in premenopausal women as compared with the reference group. Of FMI and WHR, the impact seemed inverse. The relationship between the changes in body components and SUA variability was strong and clearly dose-dependent in men and premenopausal women. However, the direction of SUA level changes was not the same among the relationship with body component changes: a positive relationship with FMI and WHR changes while a negative relationship with SMI changes.
Conclusion: We demonstrated that the changes in SMI, FMI, and WHR had a significant impact on achieving the target SUA level and the strong relationship with SUA level variability. Our results could boost the practical advice in clinics regarding physical fitness training for subjects with hyperuricemia and gout.
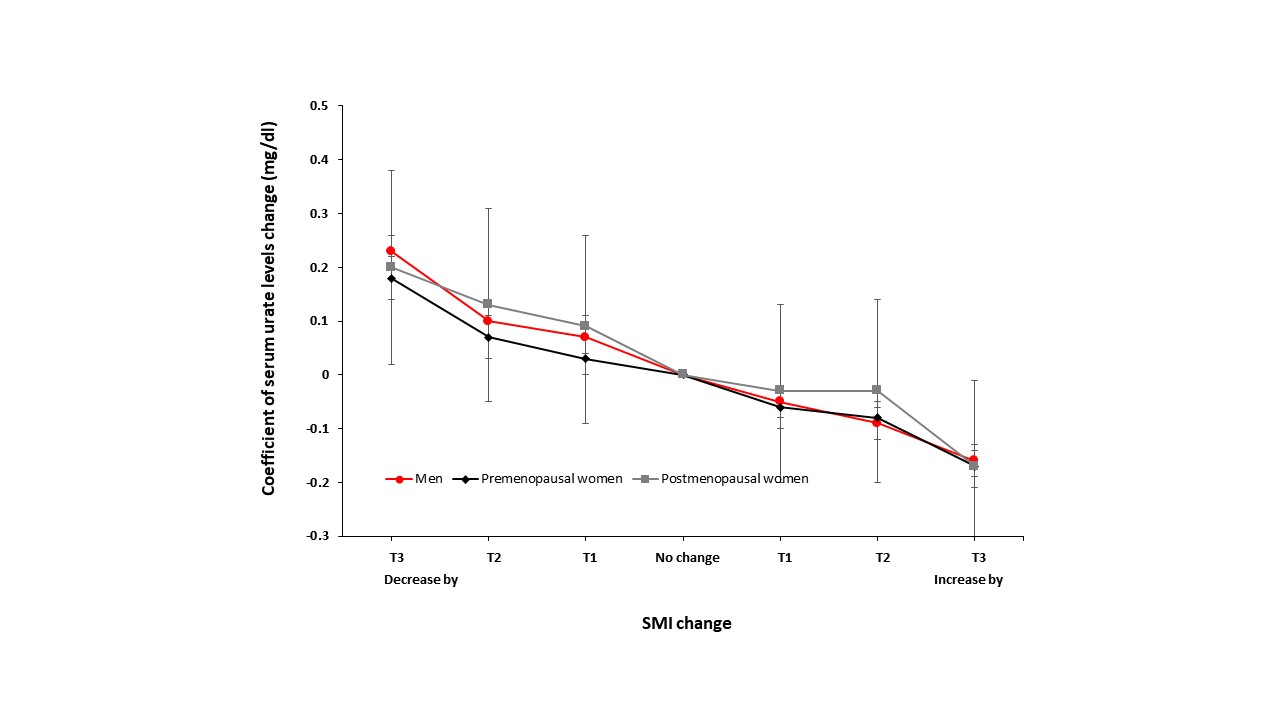
Figure 1. Association between SUA levels and SMI changes. The association was significantly strong and clearly dose-dependent along with the serial adjustment of covariates in the regression model.
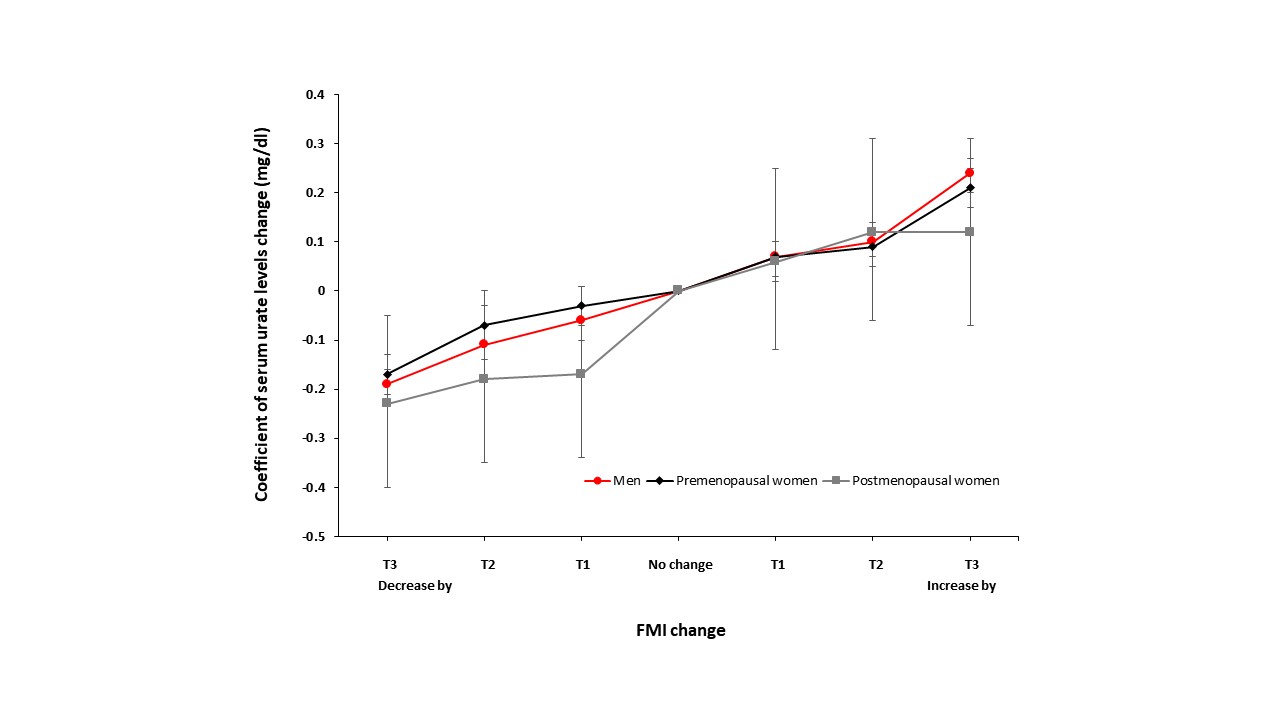
Figure 2. Association between SUA levels and FMI changes. The association was significantly strong and clearly dose-dependent along with the serial adjustment of covariates in the regression model.
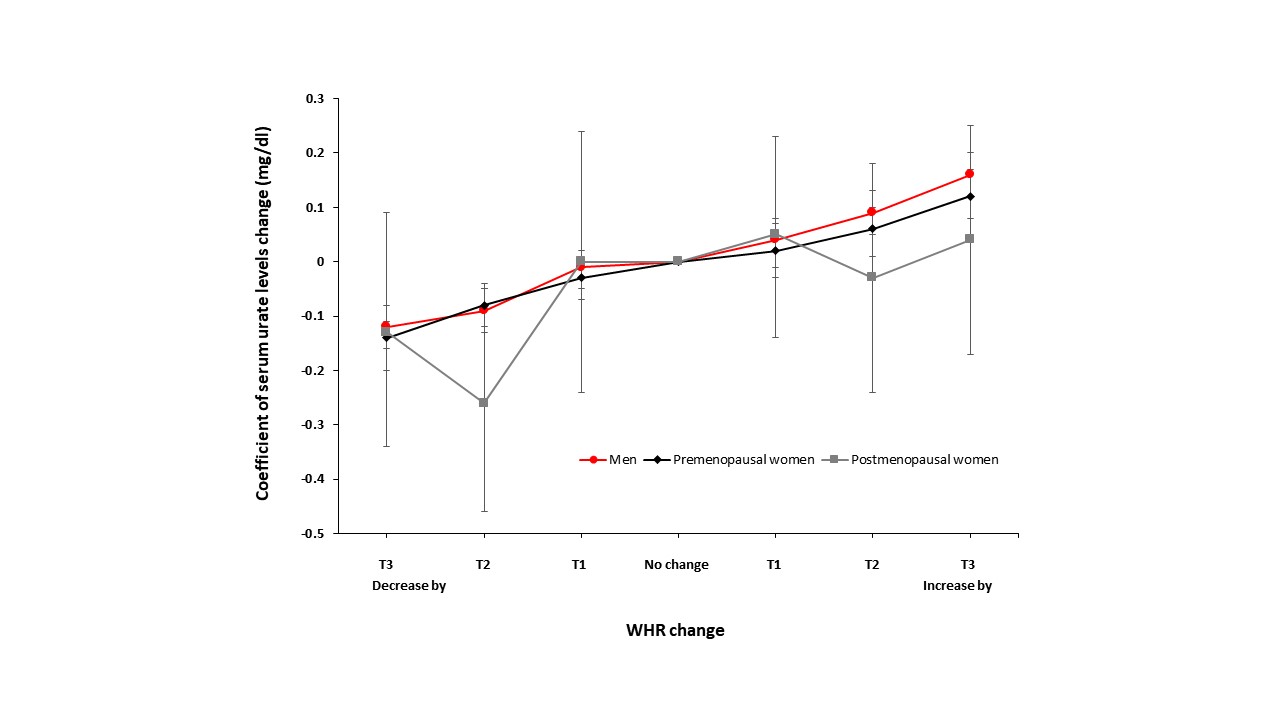
Figure 3. Association between SUA levels and WHR changes. The association was significantly strong and clearly dose-dependent along with the serial adjustment of covariates in the regression model.
J. Hwang: None; M. Lee: None; Y. Eun: None; J. Ahn: None.