Marta Sala Climent1, Martha Cedeno1, Roxana Coras2, Tiffany Holt1, Soo-In Choi3, Abha Singh4, Katherine Nguyen Nguyen5, Susan Lee1, Simone Zuffa Zuffa1, Meritxell Agustin-Perez1, Marta Fernandez-Bustamante1, Shahrokh Golshan1, Arthur Kavanaugh6 and Monica Guma5, 1University of California San Diego, San Diego, CA, 2Cedars-Sinai Medical Center, Los Angeles, CA, 3University of California San Diego, Alicante, CA, 4Department of Medicine, University of California San Diego, La Jolla, CA, 5University of California San Diego, La Jolla, CA, 6University of California San Diego, School of Medicine, Riverside, CA
Background/Purpose: Rheumatoid arthritis (RA) is a chronic condition characterized by persistent joint inflammation, functional impairment, and disability. Adhering to a Western diet has been associated with an overproduction of pro-inflammatory mediators and a reduced release of anti-inflammatory mediators. The gut microbiota plays a crucial role in determining the metabolic response to specific nutrients and can influence the levels of circulating pro- and anti-inflammatory mediators. The objective of this study is to compare the response of RA patients following either the anti-inflammatory ITIS diet or the Mediterranean diet (MD), assessing their respective improvements in various outcomes and examining the microbiome variations associated with each dietary approach.
Methods: We evaluated the effect of either ITIS diet or the MD for a period of 3 months in an evaluator blinded randomized clinical trial. In an ongoing trial, RA patients with active disease are being recruited. Physical examination is performed at each visit, along with the collection of clinical data, data on dietary adherence, and fecal samples for microbiome analysis. 16S rRNA gene amplicon profiling of the stools was performed. A generalized linear model was employed to assess the relationship between time and diet. Microbiome analysis was conducted using RStudio to describe variations in the abundance of microbial taxa associated with different diet groups and responses, defined as patients with a 50% pain improvement.
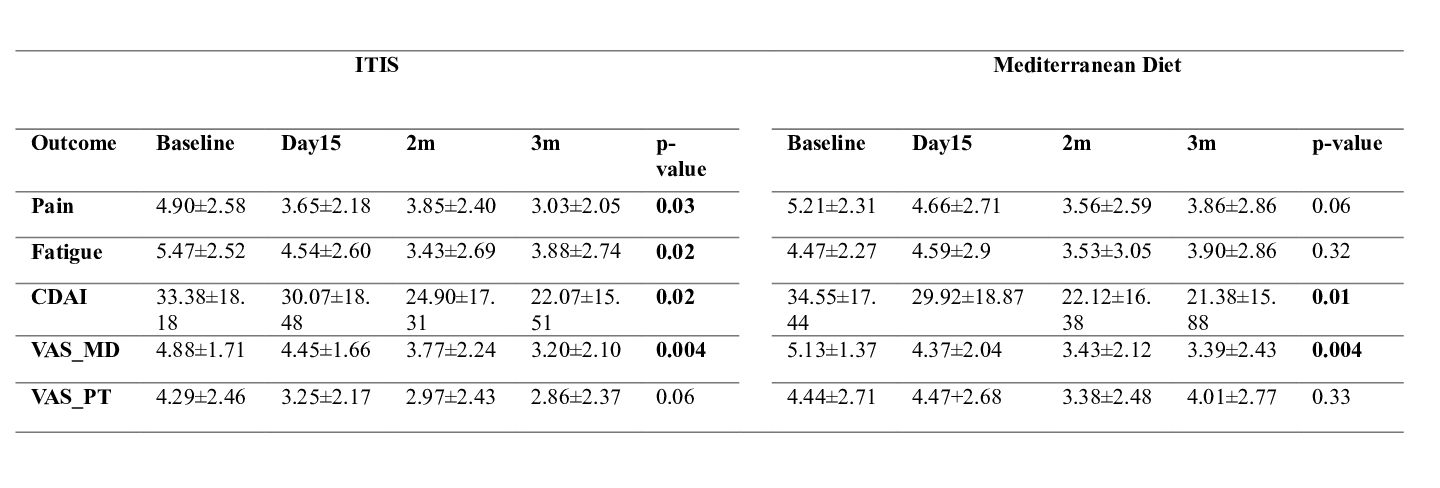
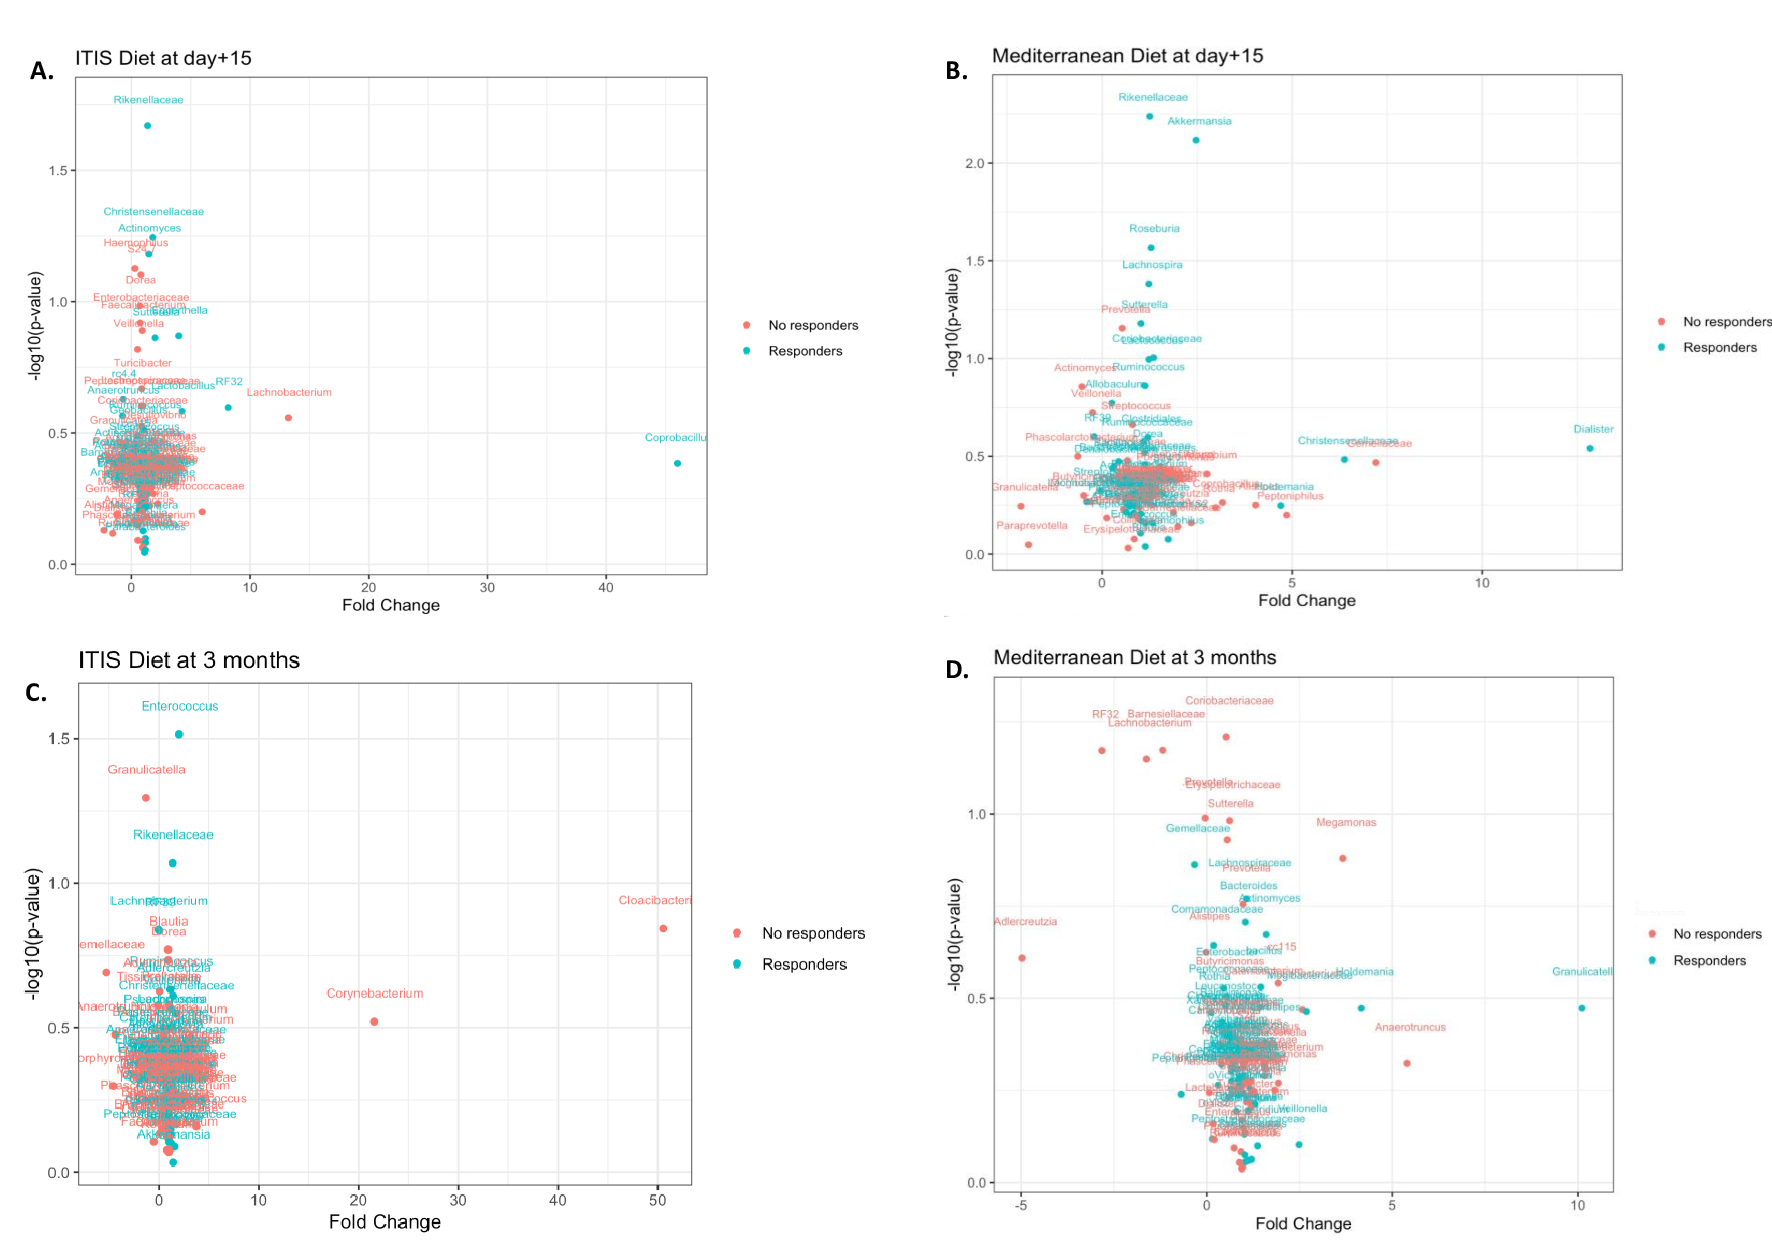
Results: A total of 44 patients (95.45% women, age average: 52.82, standard deviation (SD): 9.42), clinical disease activity index (CDAI) average 34.55 (17.44)) diagnosed with RA were recruited for this study. The study findings revealed significant improvements in health indicators among patients following the ITIS diet and MD. Specifically, patients on the ITIS diet experienced significant reductions in pain (p=0.03), fatigue (p=0.02),CDAI (p=0.02) and visual analog scale (VAS) from physician (p=0.004) at 3 months. Patients following MD had a significant decrease of CDAI (p=0.01) and VAS from physician (p=0.004) at 3 months (Table 1). Remission was achieved by 11.11% of patients on the ITIS diet, while no patients following the MD reached remission. In microbiome analysis, the differential abundance between responders (R) and non-responders (NR) for each diet was calculated. Figure 1 shows the volcano plots representing the distribution of the relative abundance of the microbiome at baseline within R and NR of each diet after 15 days and 3 months of diet intervention.
Conclusion: Preliminary results of our randomized clinical trial show improvements in clinical outcomes for both the ITIS diet and the MD. We also observed baseline differences in the microbiome between R and NR. More patients are being recruited to further investigate the differences in clinical and microbiome outcomes between the two diets.
Table 1. Table with changes of outcomes through visits in each diet, ITIS and Mediterranean diet. Significant p-values are seen in bold font. Outcomes showed here are pain measured with visual analog scale (VAS), fatigue measured with VAS, clinical disease activity index (CDAI), VAS from overall health from physician’s evaluation and VAS overall health from patient
Figure 2. Volcano plots representing the distribution of the relative abundance of the microbiome at baseline. A) Distribution of the response at day +15 of ITIS diet patients. Blue color means that responders have higher relative abundance compared to non-responders. Red color means that non-responders have higher relative abundance compared to responders. B) Distribution of the response at day +15 of Mediterranean diet patients. C) Distribution of the response at the end of the trial of ITIS patients. D) Distribution of the response at the end of the trial of Mediterranean diet patients.
M. Sala Climent: None; M. Cedeno: None; R. Coras: None; T. Holt: None; S. Choi: None; A. Singh: None; K. Nguyen: None; S. Lee: None; S. Zuffa: None; M. Agustin-Perez: None; M. Fernandez-Bustamante: None; S. Golshan: None; A. Kavanaugh: AbbVie, 1, 2, Amgen, 1, 2, BMS, 1, 2, Eli Lilly, 1, 2, Novartis, 1, 2, Pfizer, 1, 2, UCB, 1, 2; M. Guma: None.