Allen Institute for Immunology Seattle, WA, United States
Disclosure information not submitted.
Adam Savage1, Ziyuan He1, Marla Glass1, Julian Reading1, LauraKay Moss2, Marie Feser2, Vlad Tsaltskan3, Katherine Nguyen Nguyen3, Kristen Demoruelle2, kristine Kuhn4, David Boyle3, Cate Speake5, Xiao-Jun Li1, Peter Skene1, Troy Torgerson1, Tom Bumol1, V. Michael Holers6, Jane Buckner7, Gary Firestein8, kevin Deane2 and Mark Gillespie1, 1Allen Institute for Immunology, Seattle, WA, 2University of Colorado Anschutz Medical Campus, Aurora, CO, 3University of California San Diego, La Jolla, CA, 4University of Colorado School of Medicine, Aurora, CO, 5Benaroya Research Institute, Seattle, WA, 6University of Colorado, Denver, CO, 7Benaroya Research Institute at Virginia Mason, Seattle, WA, 8University of California San Diego, San Diego, CA
Background/Purpose: Seropositive RA is preceded by an at-risk stage characterized by elevated circulating autoantibodies (AAb), including ACPA, in otherwise healthy individuals without clinically-apparent inflammatory arthritis. Rising autoantibody levels prior to clinical diagnosis suggest changing immune activity but what additional immune dysregulation may be occurring in this period is incompletely understood. The purpose of this study was to profile the immune state that accompanies elevated AAb to identify novel immune features present in individuals at-risk (ARI) to develop clinical RA.
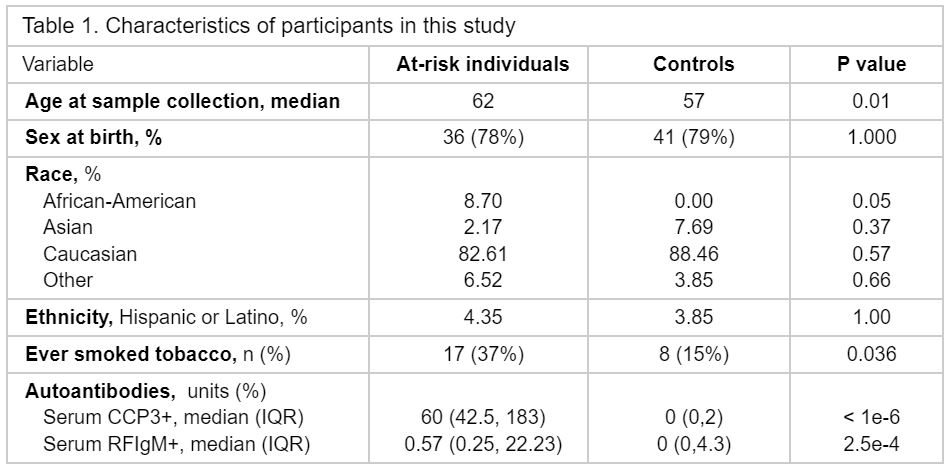
Methods: We profiled 1463 plasma proteins, 69 peripheral blood mononuclear cell (PBMC) phenotypes, and 1,973,362 PBMCs by single-cell RNA sequencing (scRNA-seq) for a cross-sectional analysis of ARI with high levels of ACPA (anti-CCP3 IgG > 40 units) compared to healthy control individuals (HCI) (Table 1). Linear regression models were used to identify differentially expressed proteins (ARI/HCI), and to identify lineage-defining gene programs in scRNA-seq. PBMC phenotypes were selected and analyzed based on their identification in the clinical RA literature to evaluate features of clinical disease present in ARI. Wilcoxon rank sum was used to evaluate the association of B cells to AAb levels. Finally, NicheNet was used to identify putative relationships between plasma proteins and gene expression in the target cells.
Results: 314 proteins exhibited significant differential expression between ARI and HCI, including CCN1, CXCL6, CCL18, OSM, CCL5, and SERPINE1, all of which were not previously reported in ARI, as well as proteins related to B cell biology, including CXCL13, SEMA4D, LIGHT, and BAFF (Fig 1A). In addition, we found evidence for features of classifiable RA, including increased IL-1B, IL-6, TNF, CCL3, and CXCL8 plasma proteins and elevated PBMC phenotypes. Among PBMC, atypical (IgD- CD27-) B cells and Tph-like (CXCR5- PD1+) CD4T cells (Fig 1B) were significantly increased. Transcriptomic analysis (scRNA-seq) of atypical B cells, enriched in ARI, demonstrated a gene program indicative of type 2-polarized memory B cells (T2MBC), including IL4R, IL13RA1, FCER2, IGHG4, IGHE, and MEF2C (Fig 2). T2MBC abundance was correlated to RF-IgM levels (Fig 1C). NicheNet analysis identified differentially-regulated proteins CCL3 (Pearson correlation coefficient (r) = 0.093), TNFSF13B (BAFF) (r = 0.077), TNFSF14 (LIGHT) (r = 0.048), and TNF (r = 0.047), as potential regulators of the T2MBC gene program.
Conclusion: We find that otherwise healthy at-risk individuals have immune dysregulation characterized by plasma protein and PBMC phenotype changes, including some that are similar to published findings in clinical RA. In particular, the number of T2MBC B cells were elevated in ARI and we recognized a relationship to RF-IgM AAb levels. Based on NicheNet analysis, we hypothesize that circulating plasma proteins in ARI reflect the maintenance or generation of T2MBC. These data deepen our understanding of this critical at-risk state and further emphasize the tight link between the dysregulation within the B cell compartment and autoimmune disease, which could be exploited for preventative therapeutic intervention.
Figure 1. (A) Volcano plot of differential plasma protein expression between at-risk (red) and control (blue) individuals. Effect sizes and P values were determined using a linear regression model. Replicate annotations of the same protein result from repeated plate assays as part of Olink’s standard protocol. (B) PBMCs from at-risk (red) and control (blue) individuals were compared for IgD- CD27- B cells (top) and CXCR5- PD1+ CD4 T cells (Tph-like; bottom) and were tested using Wilcoxon Rank Sum with Benjamini/Yekutieli correction. Each dot represents a participant. (C) At-risk individuals were categorized by RF-IgM levels as Not detected (≤ 0.25 units) or > 0.25 units and the frequency of type 2-polarized memory B cells (T2MBC) in PMBCs was tested using Wilcoxon Rank Sum.
Figure 2. Gene expression heatmap indicating the DEGs (AUC > 0.55 or AUC < 0.45 and absolute log2 fold change > 0.1) between T2MBC and switch/unswitched memory B cells. Tbet effector are shown for comparison. Scaled normalized transcripts of pseudobulk samples are displayed.
A. Savage: Adaptive Biotechnologies, 3, 11, Eli Lilly, 2, 5; Z. He: Eli Lilly, 2, 5; M. Glass: Eli Lilly, 2, 5; J. Reading: None; L. Moss: None; M. Feser: None; V. Tsaltskan: None; K. Nguyen: None; K. Demoruelle: Boehringer-Ingelheim, 5, Gilead, 5, Pfizer, 5; k. Kuhn: pfizer, 5, ucb, 2; D. Boyle: None; C. Speake: None; X. Li: Eli Lilly, 5; P. Skene: Eli Lilly, 2, 5; T. Torgerson: Eli Lilly, 2, 5, Pharming Healthcare, 2, Takeda, 2; T. Bumol: Omeros Corporation, 4; V. Holers: None; J. Buckner: Bristol-Myers Squibb(BMS), 2, gentibio, 1, 10, 11, hotspot therapeutics, 2, Janssen, 2; G. Firestein: Eli Lilly, 5; k. Deane: Bristol-Myers Squibb(BMS), 1, Gilead, 5, Janssen, 5, Werfen, 1, 12, Biomarker kits; M. Gillespie: Eli Lilly, 2, 5, Novo Nordisk, 3, 12, Stock.


.jpg)
.jpg)
