Baylor College of Medicine Houston, TX, United States
Disclosure information not submitted.
Anna Thompson1, Jessica Nguyen2, Amanda Braddock1, Shelley Kumar1 and Miriah Gillispie-Taylor3, 1Baylor College of Medicine, Houston, TX, 2Baylor College of Medicine, Manvel, TX, 3Baylor College of Medicine, Texas Children's Hospital, Houston, TX
Background/Purpose: Childhood rheumatologic and musculoskeletal diseases (RMDs) have an estimated prevalence of 1:300,000 in the general population and are associated with morbidity and mortality in children. Approximately 30% of acute pediatric visits are for musculoskeletal (MSK) complaints, often the initial presenting symptom of RMDs, while only 2% of pediatric board examinations cover rheumatologic topics. Additionally, there is a variable amount of graduate medical education (GME) pediatric rheumatology training due to a paucity of pediatric rheumatologists nationwide, with 33% of medical schools and 40% of pediatric residency programs having no affiliated pediatric rheumatologist. This discrepancy highlights the need to improve the education of pediatric providers to evaluate and appropriately triage presentations concerning for RMDs.
Within GME, learner engagement, motivation, and enjoyment pose a significant challenge. Previous studies have shown gamification to be an effective strategy in addressing these issues by promoting risk-free decision-making, providing quick feedback, and demonstrating improvement in student knowledge and achievement. In this vein, we developed a gamified rheumatology review intervention using, Instagram (IG), a social media platform to determine effects on learner engagement and information retention.
Methods: Board-style questions covering RMDs were written to target GME learners. A Question of the Week (QOTW) is posted weekly to the Baylor College of Medicine (BCM) Pediatric Residency business IG page (with approximately 1600 followers) for 24 hours. The correct response is revealed immediately, and the following day an explanation is posted for 24 hours. Available data from IG was collected, including number of viewers per question and response, and response breakdown. The following week, the usernames associated with the first five correct answers are posted, incorporating gamification and friendly competition. Additionally, surveys collected information on enjoyment of QOTW, perceived knowledge acquisition, and preferred question difficulty.
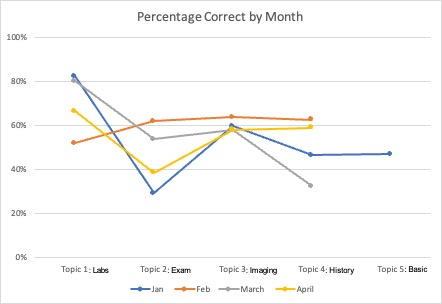
Results: Engagement with QOTW has been tracked for 4 months and was higher than expected. Figure 1 depicts the percent correct broken down by month and weekly topic, showing the highest average of correct answers regarding imaging. Figure 2 illustrates user engagement derived from unique username. Additional IG surveys showed 94% of users enjoyed QOTW, 100% learned from it, and 56% of respondents would prefer more challenging questions.
Conclusion: This data indicates that the QOTW educational intervention utilizing IG as a delivery method unites gamification and formative assessment in the social media space. Given the frequent interaction with social media by young learners, we are successfully able to utilize this platform to reach and engage many more learners than traditional teaching methods. Ultimately, we believe this method is an effective way to educate our target audience - pediatricians, residents, and medical students - which will improve recognition, work up, and timely, appropriate referral for those patients with concerns for RMDs.
Figure 1. Percent of correct answers separated by month. Questions released during the first week of the month always cover laboratory studies in RMD, week two covers physical exam findings, week 3 covers imaging, week 4 covers history and clinical criteria, and when there is a 5th week, it is dedicated to basic science. Users most consistently correctly responded to questions covering imaging in RMD, ~60% of respondents answered correctly. Of all items, 12% were noted to be "easy," 6% were "difficult," and the remaining 82% were in the "average" difficulty index.
Figure 2. Number of actual and predicted unique users engaging with IG content by week. For the first 17 weeks, there were 395 question views, 110 responses, 403 answer views, and 376 explanation views. The total number of question views was not recorded for week 4, so this week was not used to forecast. Of note, there was also a notable jump in views on week 11, which coincided with resident match day. Predictions were made for the next three months using the SAS ESM procedure, which generates forecasts using exponential models with optimized smoothing weights for time series models.
A. Thompson: None; J. Nguyen: None; A. Braddock: None; S. Kumar: None; M. Gillispie-Taylor: None.


.jpg)
