1959: Quantitative Scoring of High Resolution Chest Computed Tomography (HRCT) Images in Myositis and Antisynthetase Syndrome Related Interstitial Lung Disease in Comparison to Scleroderma Related Interstitial Lung Disease
Sangmee Bae1, Fereidoun Abtin2, Grace Kim3, Siamak Moghadam-Kia4, Chester V. Oddis5, Lila Pourzand2, Didem Saygin5, Daniel Sullivan6, Koichi Yamaguchi7, Donald Tashkin3, Christina Charles-Schoeman8, Jonathan Goldin3 and Rohit Aggarwal5, 1UCLA Rheumatology, Los Angeles, CA, 2UCLA Radiological Sciences, Los Angeles, CA, 3University of California Los Angeles, Los Angeles, CA, 4University of Pittsburgh Medical Center, Pittsburgh, PA, 5University of Pittsburgh, Pittsburgh, PA, 6UCLA Pulmonology, Pittsburgh, PA, 7University of Pittsburgh Medical Center Rheumatology, Pittsburgh, PA, 8UCLA Medical Center, Santa Monica, CA
Background/Purpose: High resolution computed tomography (HRCT) of the chest has become an important modality in the evaluation of interstitial lung disease (ILD). A quantitative CT scoring method using a computer aided diagnostic system to measure the nature and extent of parenchymal diseases has been used to measure treatment response in the scleroderma lung study II (SLSII). The current study aims to describe quantitative CT scores in myositis and antisynthetase syndrome related ILD in comparison to scleroderma ILD (SSc-ILD).
Methods: Quantitative CT scores were performed on HRCT scans obtained from the Abatacept for the Treatment of Myositis-Associated ILD (Attack My-ILD) clinical trial which was a 12-month study including 20 adult patients with antisynthetase syndrome and active ILD (ASSD-ILD). We compared baseline scores with a subgroup of an observational cohort of myositis patients with ILD (Myositis-ILD), and the SLS II cohort which included patients with limited or diffuse scleroderma and active ILD (SSc-ILD). Quantitative CT scores were compared between the 3 ILD cohorts at baseline, and scores over time were compared between the two clinical trial cohorts (ASSD-ILD and SSc-ILD). Images were also assessed visually by thoracic radiologists.
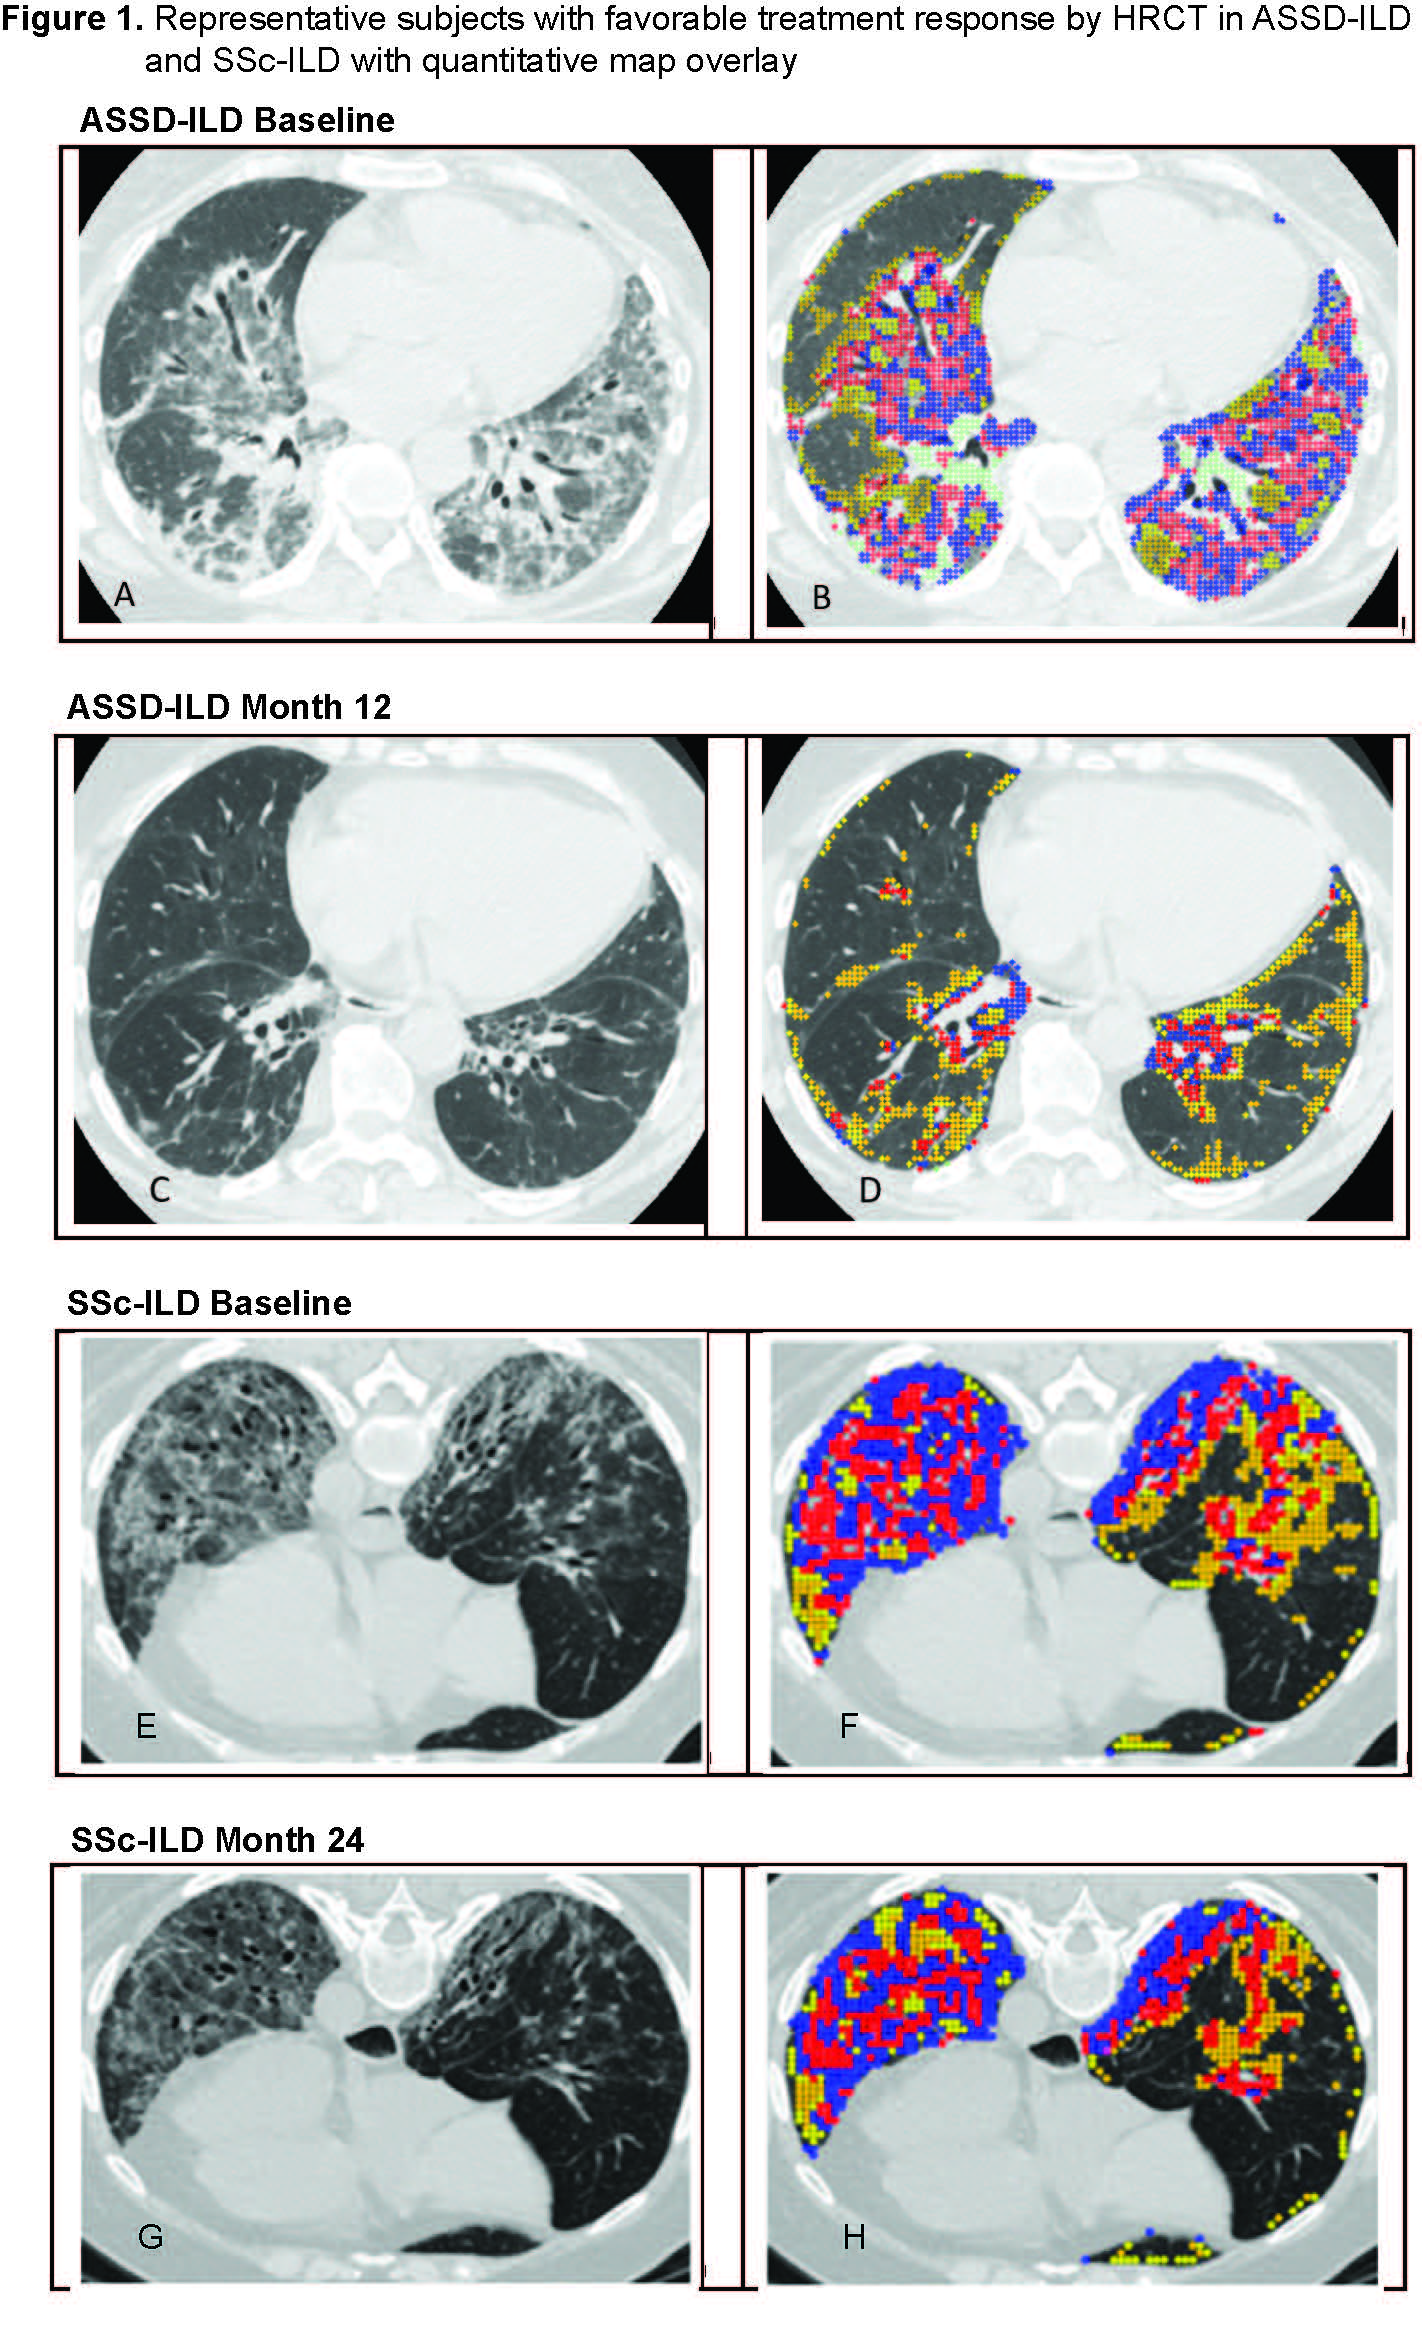
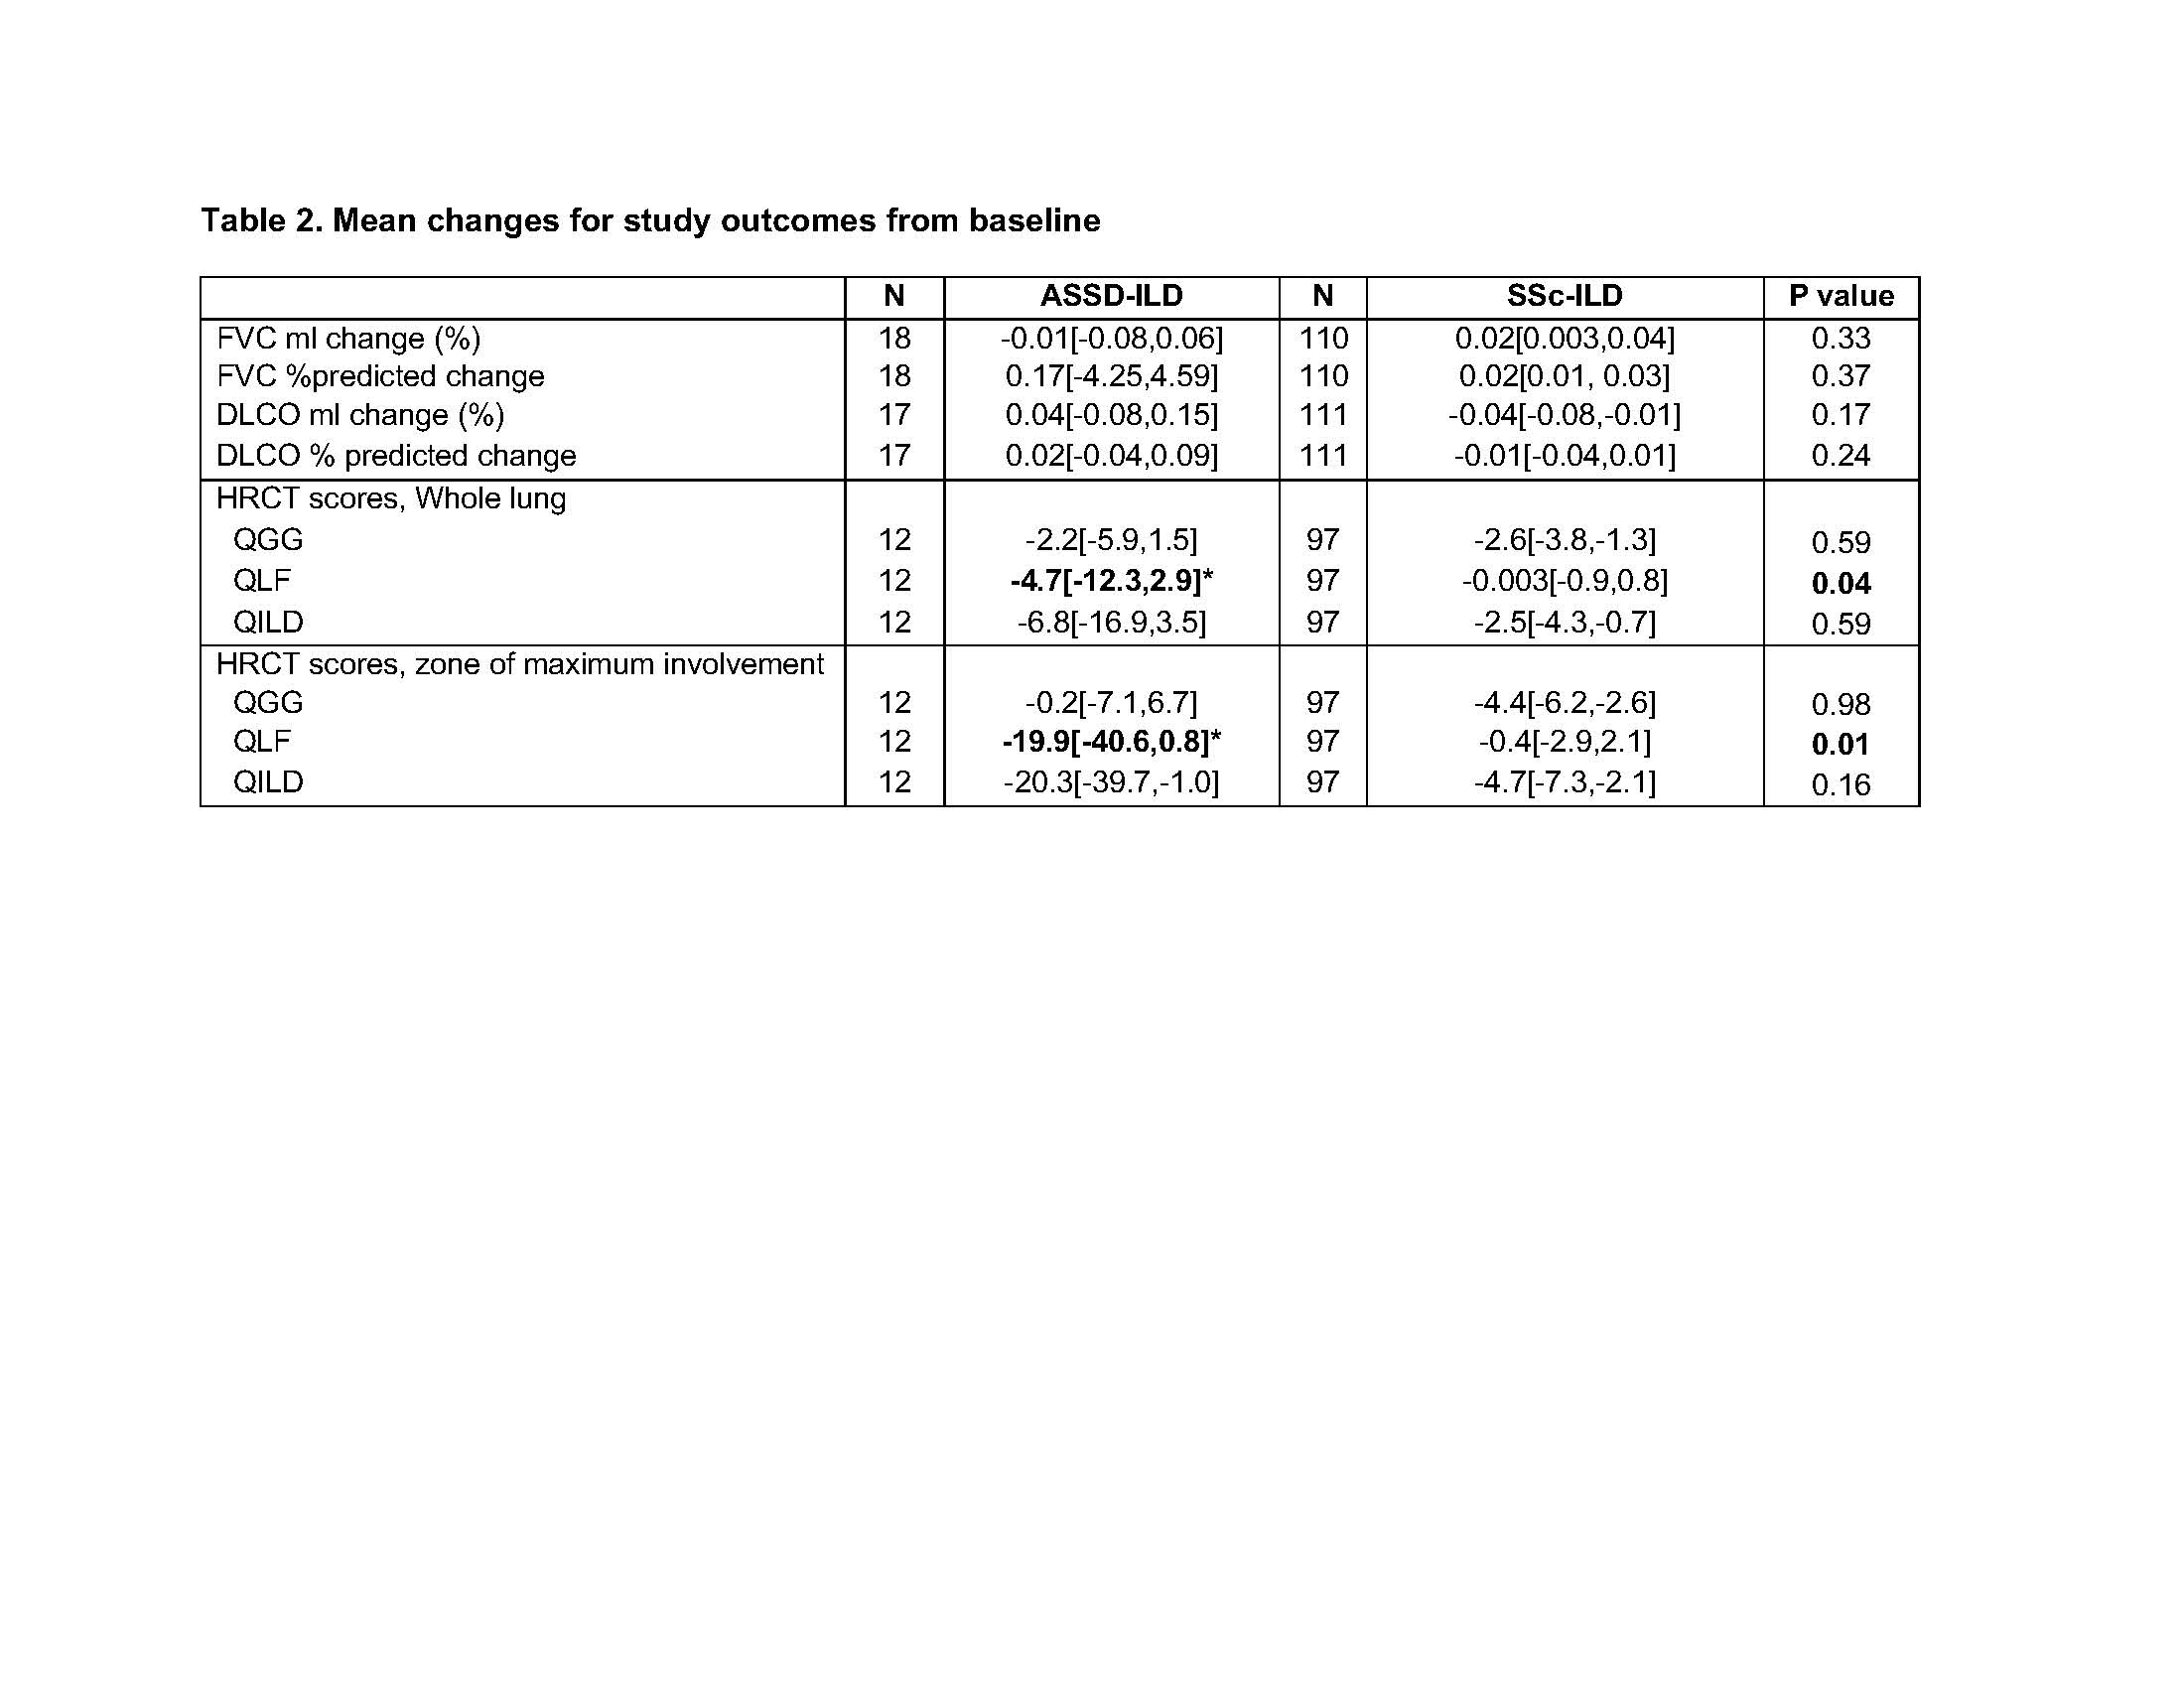
Results: Baseline characteristics are described in Table 1. The ASSD-ILD group had lowest forced vital capacity(FVC) and diffusing capacity (DLCO) and highest quantitative scores for ground glass (QGG), fibrosis (QLF) , honeycombing (QHC) and total sum of disease (QILD) among the 3 cohorts. Zone of maximum involvement was shared throughout upper, middle and lower zones in ASSD- and Myositis-ILD, unlike SSc-ILD where 94% had maximum disease in the lower zones of the lung. Visual review of the ASSD-ILD and Myositis-ILD images revealed a pattern distinct from SSc-ILD (Figure 1). In ASSD- and Myositis-ILD, there are areas of confluent fibrosis that mimic organizing pneumonia with fibrosis and volume loss. Also, the disease extends to the periphery of the lung, unlike SSc-ILD which tends to spare the periphery. Both diseases demonstrate ground glass opacity and reticulations with bronchiectasis. In comparing subjects that showed favorable treatment response from the two clinical trials, the ASSD-ILD patient showed marked improvement in CT images (Figure 1-A to C) which was also reflected in changes in their quantitative scores (Figure 1-B to D), whereas in the SSc-ILD subject the improvement was more subtle (Figure 1 E,F to G,H). Mean changes in lung physiology and quantitative CT scores over the trial period demonstrated that QLF scores in the ASSD-ILD cohort showed greater improvement compared to the SSc-ILD cohort despite its shorter follow up time and the lack of differences in changes in FVC or DLCO between the groups (Table 2).
Conclusion: HRCT images from ASSD-ILD and Myositis-ILD demonstrate a pattern that is distinct from SSc-ILD. ASSD-ILD shows more marked improvement in HRCT images with treatment than SSc-ILD which is reflected as a significantly greater decrease in quantitative CT scores over time compared to SSc-ILD. Further studies are needed to better characterize and quantify HRCT images in myositis and antisynthetase syndrome related ILD.
Values are in Mean±SD, Median[IQR] for skewed data, N(%) Zone of maximum involvement was defined as the lobe with the highest QLF score. Zones are defined as area-equivalent regions of the lung across the upper, middle and lower regions of each lung. Note, difference in disease duration. ASS was within 3 months or recent worsening, ssc was mean 2.6 years (0.3-7.1 years) Max lobe based on lobe with highest QILD2 *p<0.05 compared to SSc-ILD group
Representative subjects with favorable treatment response by high-resolution computed tomography (HRCT) in ASSD-ILD (A-D) and SSc-ILD (E-H). In the quantitative map overlay (right panel), the sum of the blue and red areas represents the extent of quantitative lung fibrosis (QLF), and the yellow area represents the extent of quantitative ground glass(QGG). The sum of all the colors represents quantitation of total ILD (QILD).
(A,B) In ASSD-ILD, there is mixed ground glass and consolidative infiltrates in lower lobes with thick walled reticulations and mild bronchiectasis with some volume loss. The pattern of fibrosis is inconsistent with UIP and favors but not classic for organizing pneumonia. Follow up image (C,D) demonstrates significant decrease in the lung infiltrates with residual reticular lines and limited loss of volume. The quantitative overlay shows significant decrease in QLF and QGG. (E,F) In SSc-ILD, HRCT at baseline demonstrates lower lobe course ground glass opacity with reticulations and traction bronchiectasis/bronchiolectasis and relative subpleural sparing best seen on the left side. (G) After 24 months, there is subtle decrease in density of ground glass and extent and thickness of reticulations but persistent bronchiectasis/bronchiolectasis. (H) Quantitative map overlay at 24 months demonstrates decrease in QLF shaded as red and blue.
Values reported as mean change[95%CI]. Change in FVC in ml indicates (FVC in ml at 12 months – FVC in ml at baseline)/(FVC in ml at baseline) Change in DLCO in ml indicates (DLCO in ml at 12 months – DLCO in ml at baseline)/(DLCO in ml at baseline) % predicted change were absolute differences between baseline and 12 months Follow up time between quantitative CT scores were 12 months for ASSD-ILD trial and 24 months for SSc-ILD trial.
S. Bae: None; F. Abtin: None; G. Kim: MedQIA, 2; S. Moghadam-Kia: None; C. V. Oddis: Boehringer-Ingelheim, 5, Cabaletta, 5, EMD Serono, 5, Novartis, 5, Pfizer, 1; L. Pourzand: None; D. Saygin: None; D. Sullivan: None; K. Yamaguchi: None; D. Tashkin: None; C. Charles-Schoeman: AbbVie, 2, 5, Alexion, 5, BMS, 2, 5, Boehringer Ingleheim, 2, 5, CSL Behring, 5, Galapagos, 2, Pfizer, 2, 5, Priovant, 2, 5, Recludix, 2; J. Goldin: MedQIA, 12, Founder; R. Aggarwal: Actigraph, 2, Alexion, 2, ANI Pharmaceuticals, 2, Argenx, 2, AstraZeneca, 2, Boehringer-Ingelheim, 2, 5, Bristol-Myers Squibb(BMS), 2, 5, CabalettaBio, 2, Capella Bioscience, 2, Corbus, 2, CSL Behring, 2, EMD Serono, 2, 5, Galapagos, 2, Horizon Therapeutics, 2, I-Cell, 2, Janssen, 2, 5, Kezar, 2, Kyverna, 2, Mallinckrodt, 5, Merck, 2, Octapharma, 2, Pfizer, 2, 5, Q32, 5, Roivant, 2, Sanofi, 2, Teva, 2.