Session: (1734–1775) RA – Etiology and Pathogenesis Poster
1742: Sputum Citrullinated Proteins and Sputum Anti-Cit-S100A8/A9 IgG Antibodies Are Increased in Serum Anti-CCP-IgG Positive Individuals Who Developed RA
Rachna Talluri1, Sudeshna Sen2, Timothy Wilson3, Adam Savage4, Mark Gillespie4, Tom Bumol4, Marie Feser1, Jill Norri5, Michael Holer1, kevin Deane1, Paul Thompson2 and Kristen Demoruelle1, 1University of Colorado Anschutz Medical Campus, Aurora, CO, 2University of Massachusetts Chan Medical School, Worcester, MA, 3Thomas Jefferson University, Philadelphia, PA, 4Allen Institute for Immunology, Seattle, WA, 5Colorado School of Public Health, Denver, CO
Background/Purpose: The presence of anti-CCP-IgG in the blood identifies individuals who are "at-risk" of developing RA. Our group has reported that in a cohort of serum anti-CCP-IgG positive at-risk individuals, 27% developed RA within 3 years. Remarkably, the rate of incident RA increased to 57% in at-risk individuals who were also sputum anti-CCP positive. Because anti-CCP detects ACPA directed to joint-based citrullinated (cit) proteins/peptides, we explored the presence of lung-based cit-proteins and associated ACPA in sputum from at-risk individuals who did or did not later develop RA.
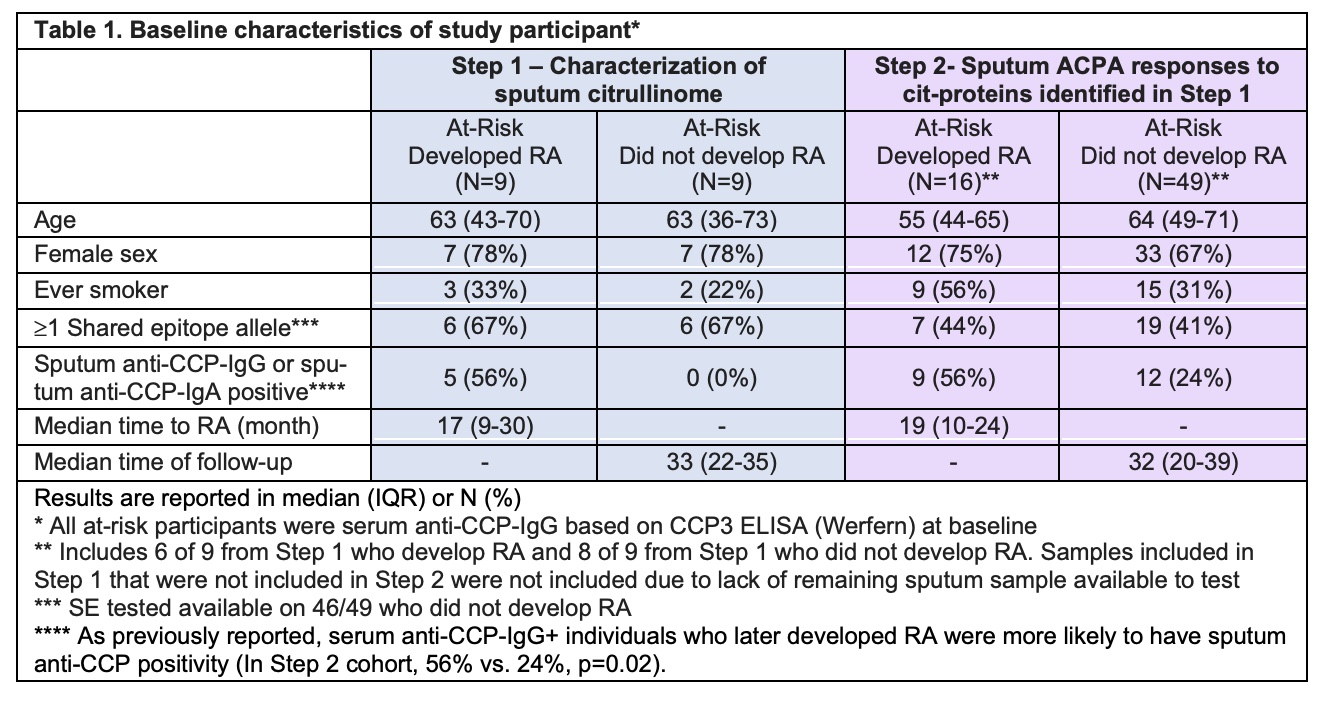
Methods: We performed a two-step study using stored baseline sputum from a cohort of serum anti-CCP-IgGpositive at-risk individuals categorized as having 'developed RA' or 'did not develop RA' within 3 years of longitudinal follow-up. In Step 1, we determined presence of cit-proteins using pooled sputum from nine at-risk individuals who developed RA and nine matched individuals who did not develop RA. Cit-proteins were enriched using biotin labeled phenylglyoxal (chemically binds all citrulline) followed by streptavidin enrichment. Three replicates were tested for each group and cit-protein levels were compared between groups using Reductive Dimethylation based quantitative proteomics. In Step 2, we quantified ACPAs directed to a subset of the cit-proteins identified in Step 1 using baseline sputum from an expanded cohort (n=65, 16 who developed RA and 49 who did not develop RA) and using a customized antigen microarray containing native and citrullinated whole proteins (GeneCopoeia OmicsArray). Cit-specific IgG and IgA reactivity was quantified by net signal intensity (background signal subtracted) normalized to internal Ig controls and subtracting native protein from cit-protein reactivity. Sputum anti-CCP-IgG and anti-CCP-IgA were quantified by ELISA and positive cut-off level established in a non-diseased control group.
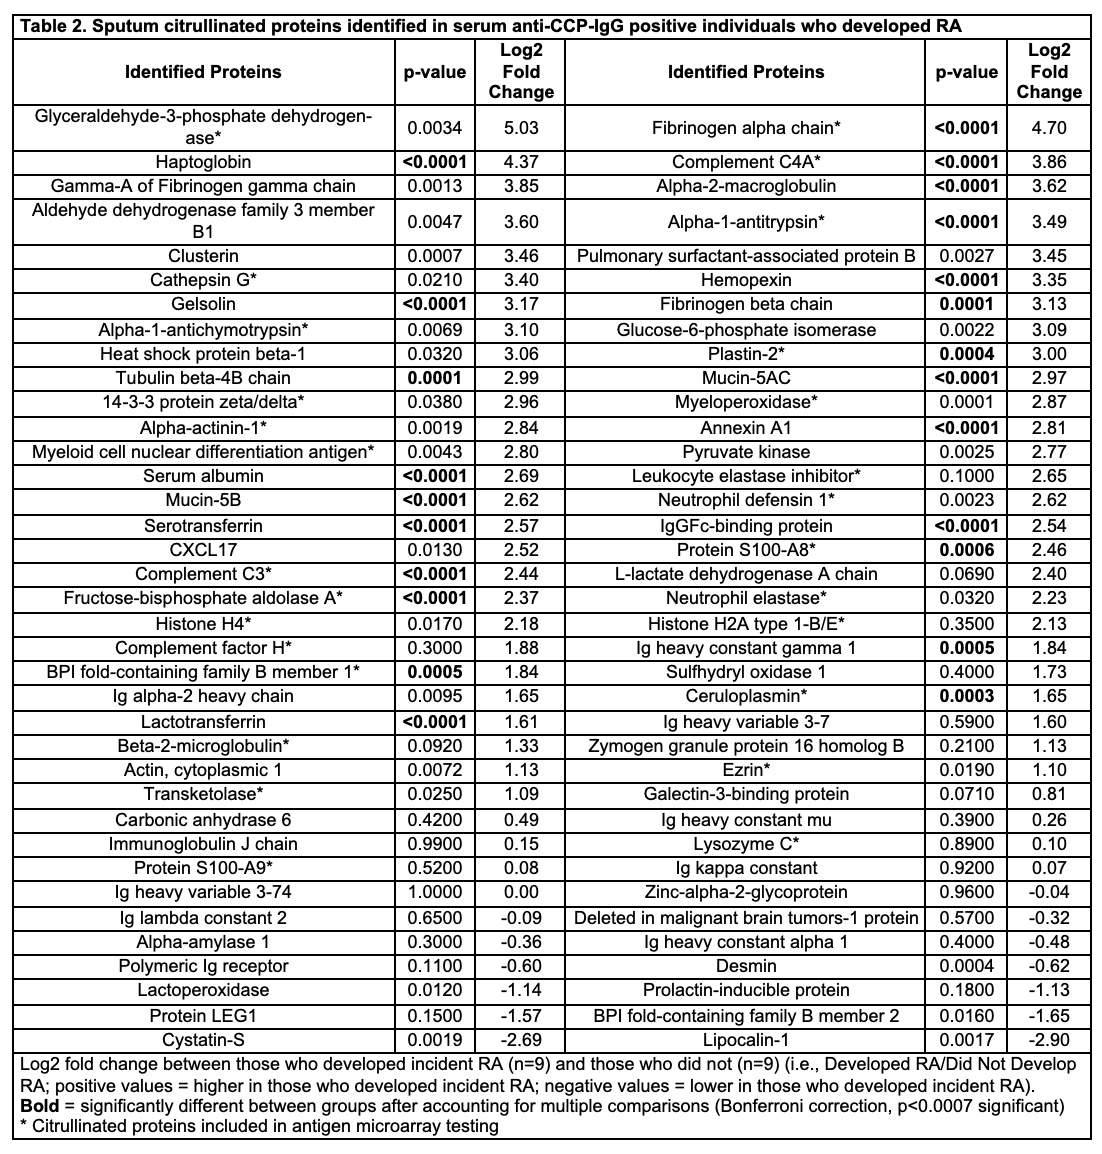
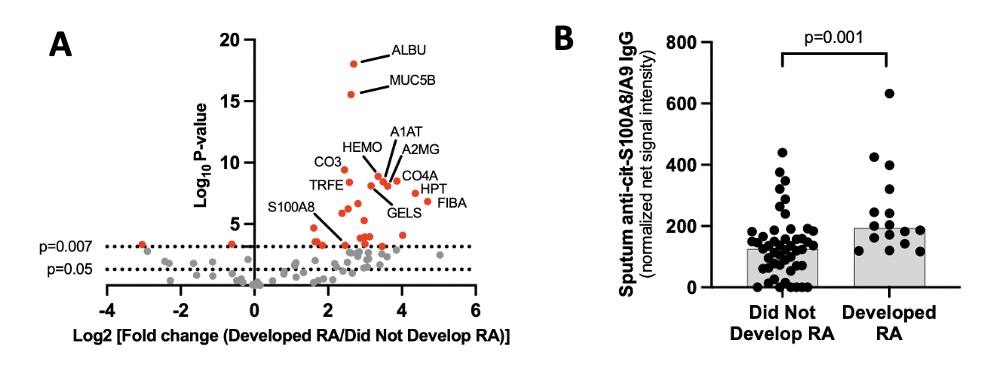
Results: The cohort characteristics are described in Table 1. In Step 1, we identified 74 distinct cit-proteins in sputum (Table 2, Figure 1). Of those, 23 were significantly increased in those who developed incident RA (Table 2). In step 2, 27 of the 74 cit-proteins identified in Step 1 were tested for sputum antibody reactivity. Only sputum levels of anti-cit-S100A8/A9 IgG were significantly higher in individuals who developed RA (Figure 1). Within individuals who developed RA, sputum anti-cit-S100A8/A9 IgG correlated with sputum anti-CCP-IgG (r=0.53, p=0.03) but not sputum anti-CCP-IgA levels (p=0.12).
Conclusion: Our findings demonstrate the sputum citrullinome in serum anti-CCP-IgG positive at-risk individuals for the first time. We identified 23 sputum cit-proteins that were increased in at-risk individuals who later developed RA. Of note, multiple cit-proteins were present in sputum, and sputum antibody reactivity was detectable at some level to many of these cit-proteins. However, only sputum anti-cit-S100A8/A9 (i.e. calprotectin) IgG was significantly higher in at-risk individuals who later developed RA. This supports future studies to understand the effect of this ACPA in RA development and to understand the effects of citrullination on protein function in the lung during RA development.
Figure 1. Sputum citrullinated proteins and sputum anti-cit-S100A8/A9 IgG antibody levels in serum an-ti-CCP-IgG positive at-risk individuals. Panel A depicts a volcano plot with the log2 (fold change) for ratios in (developed RA/did not develop RA) on the x-axis and log10 p-values on the y-axis. As such, cit-proteins to the right are increased in individuals who developed RA compared to individuals who did not develop RA. Lines correspond to a p-value of 0.05 and 0.007 (p<0.007 was significant after accounting for multiple com-parisons). Panel B depicts sputum anti-cit-S100A8/A9 IgG levels stratified by those who developed RA and those who did not develop RA within 3 years. P-values calculated based on Wilcoxon rank sum test and ac-counting for multiple comparisons (Bonferroni correction, p<0.002 significant). Abbreviations for selected pro-teins in Panel A: ALBU=serum albumin, MUC5B=mucin 5B, S100A8=S100-A8 protein, TRFE=lactotransferrin, CO3=complement C3, HEMO=Hemopexin, A1AT=alpha-1 antitrypsin, A2MG=alpha-2 macroglobulin, CO4A=complement C4A, HPT=haptoglobin, FIBA=fibrinogen alpha chain, GELS=gelsolin.
R. Talluri: None; S. Sen: Curadev Pharma, 3; T. Wilson: None; A. Savage: Adaptive Biotechnologies, 3, 11, Eli Lilly, 2, 5; M. Gillespie: Eli Lilly, 2, 5, Novo Nordisk, 3, 12, Stock; T. Bumol: Omeros Corporation, 4; M. Feser: None; J. Norri: None; M. Holer: None; k. Deane: Bristol-Myers Squibb(BMS), 1, Gilead, 5, Janssen, 5, Werfen, 1, 12, Biomarker kits; P. Thompson: Danger Bio, 8, Padlock Therapeutics, 8; K. Demoruelle: Boehringer-Ingelheim, 5, Gilead, 5, Pfizer, 5.