Jiri Baloun1, Kristyna Bubova1, Aneta Pekacova2, Lucia Ondrejcakova3, Vladimir Cervenak4, Monika Gregova5, Sarka Forejtova5, Jana Horinkova1, Jindriska Gatterova6, Michal Tomcik7, Jiri Vencovsky7, Karel Pavelka8 and Ladislav Senolt9, 1Institute of Rheumatology, Prague, Czech Republic, 2First faculty of medicine, Charles University, Prague, Czech Republic, 3Institute of Rheumatology and Department of Rheumatology, First Faculty of Medicine, Charles University, Prague, Czech Republic, 4Department of Medical Imaging, St Anne's University Hospital, and Faculty of Medicine, Masaryk University, Brno, Czech Republic, 5Institute of Rheumatology and Department of Rheumatology, First Faculty of Medicine, Prague, Czech Republic, 6Rheumatology Institute, Prague, Czech Republic, 7Institute of Rheumatology, Prague, Czech Republic, Department of Rheumatology, 1st Faculty of Medicine, Charles University, Prague, Czech Republic, 8Institut of Rheumatology and Department of Rheumatology, First Faculty of Medicine, Charles University, Praha, Czech Republic, 9Institute of Rheumatology and Department of Rheumatology, First Faculty of Medicine, Praha, Czech Republic
Background/Purpose: Axial spondyloarthritis (AxSpA) is a frequent inflammatory disease with a significant impact on a patient's quality of life. Therefore, early diagnosis and recognition of patients with rapid structural progression are of great importance. This pilot study aimed to profile the plasma proteome and disclose candidate biomarkers differentiating patients with structural radiographic progression after two years.
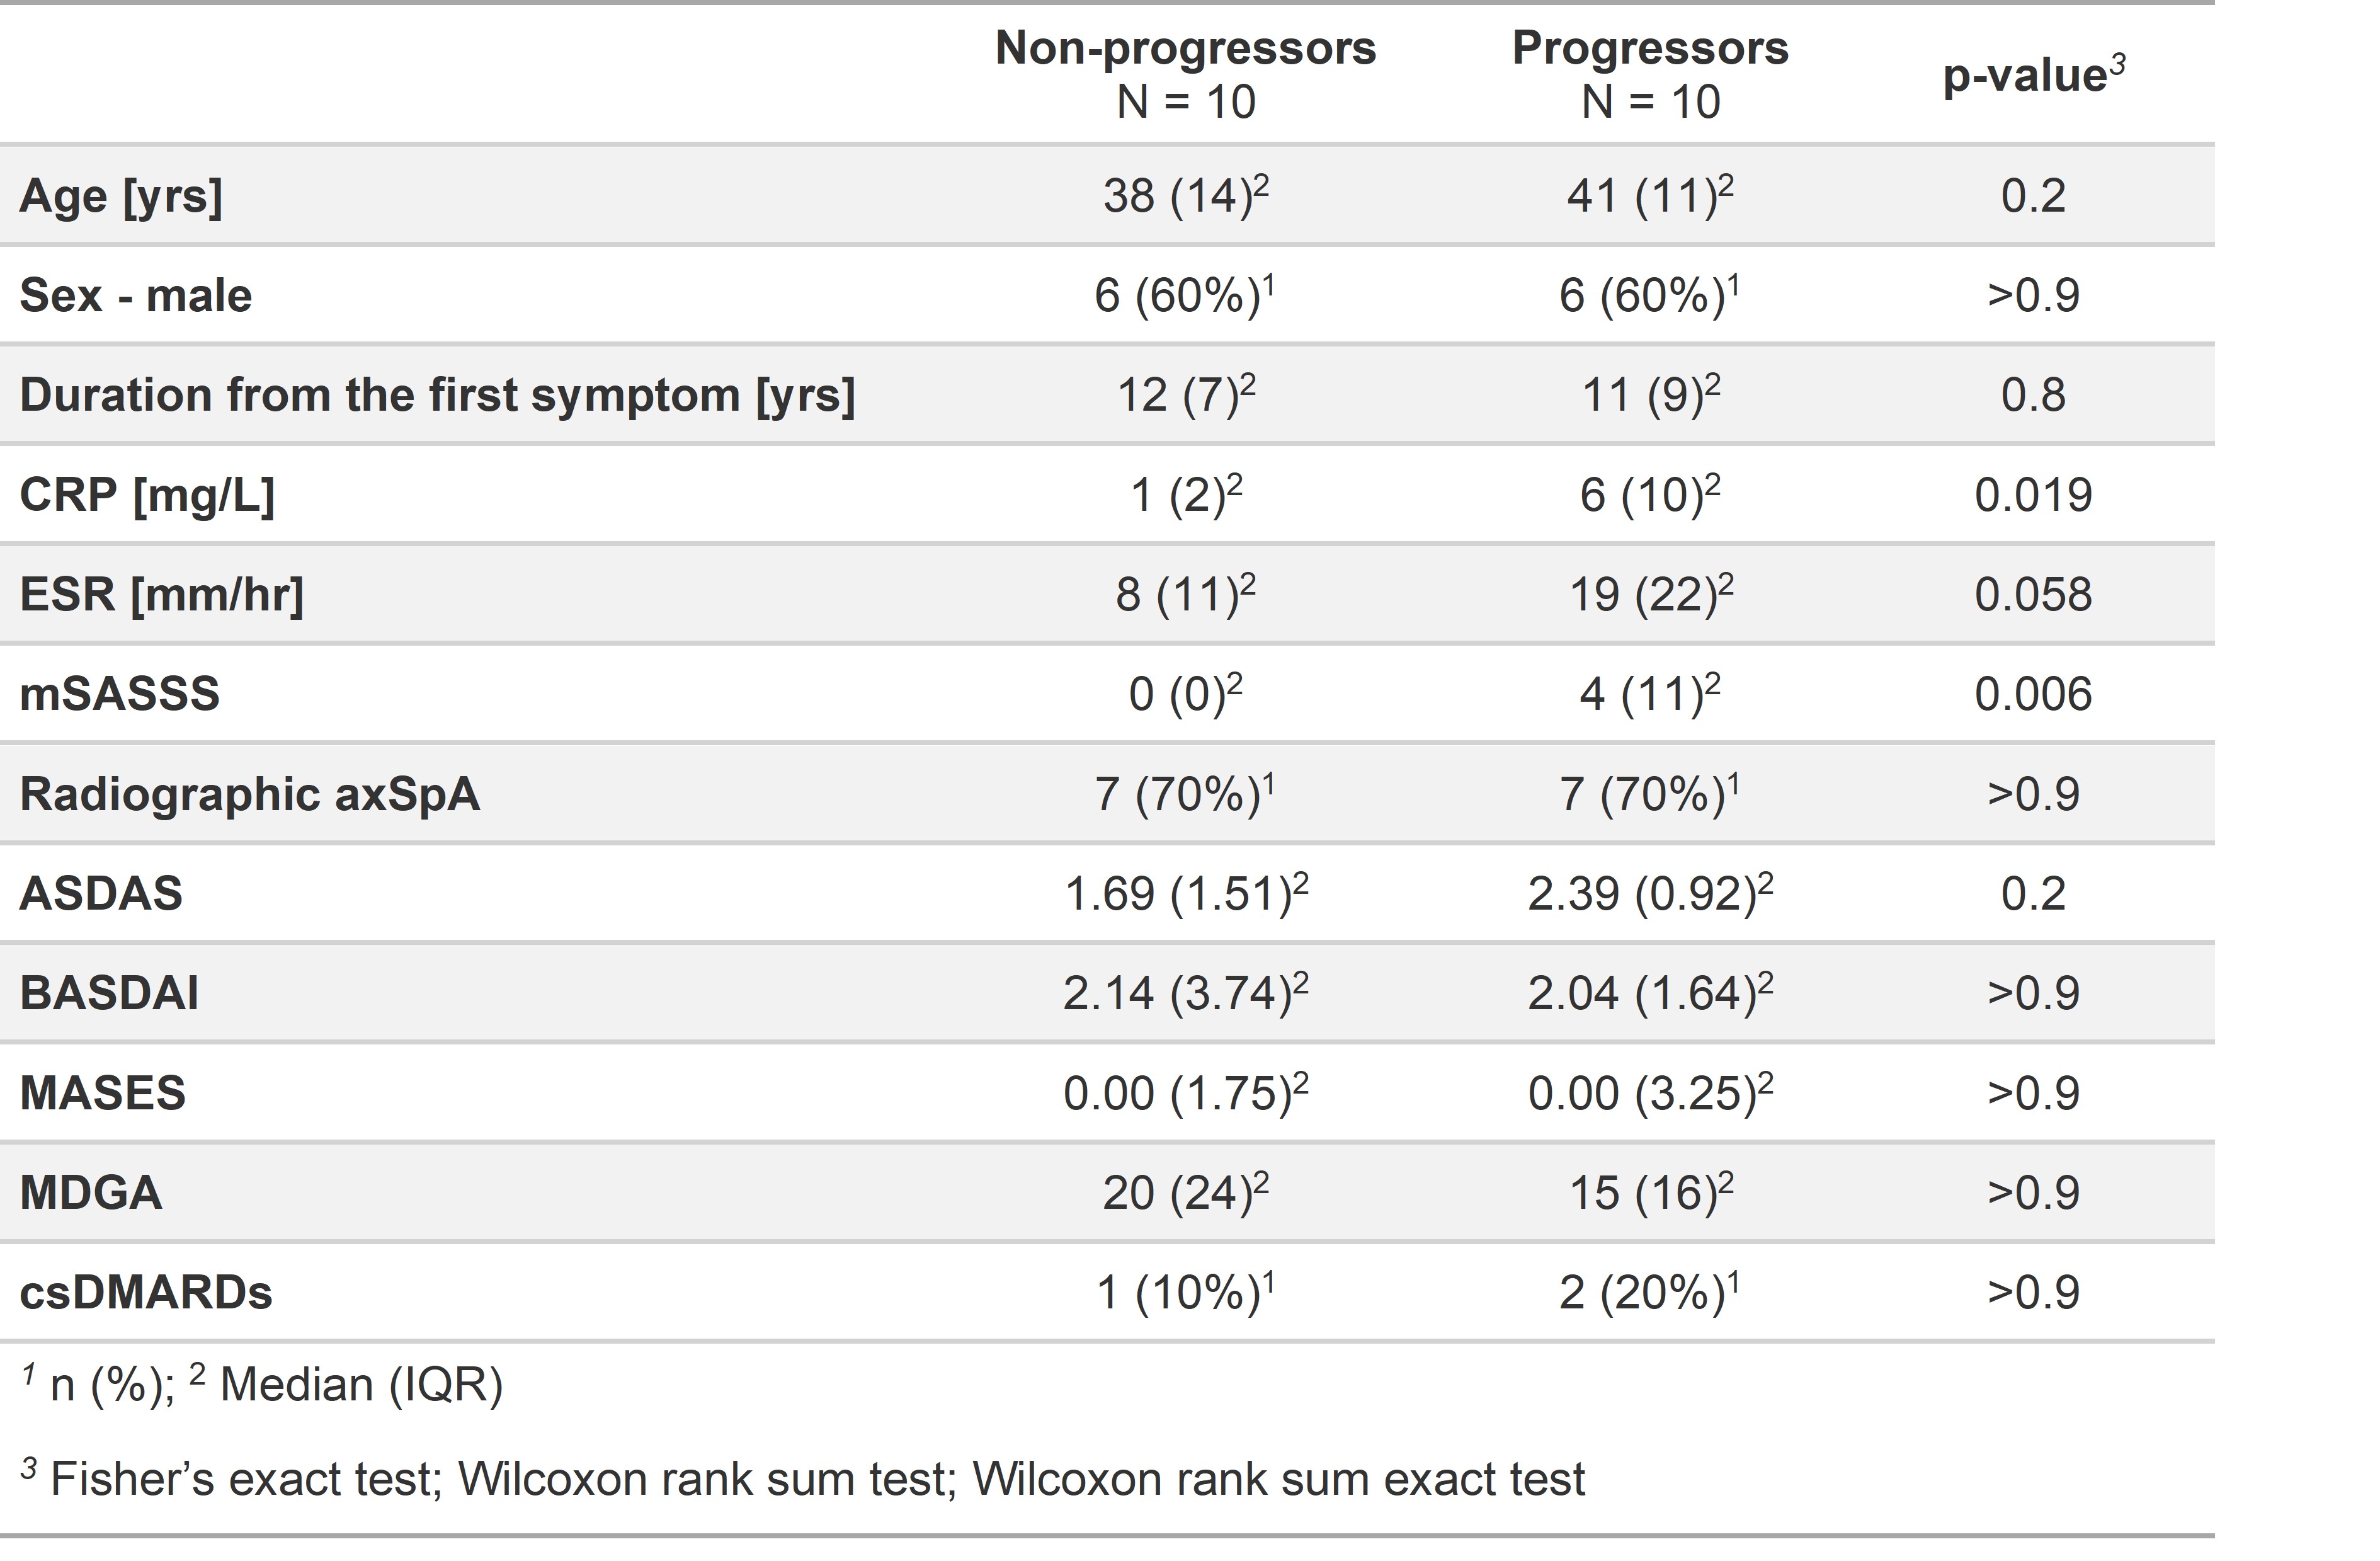
Methods: Twenty patients with ax-SpA fulfilling the ASAS classification criteria were selected according to an increase in the modified Stoke Ankylosing Spondylitis Spinal Score (mSASSS) after a 2-year follow-up into radiographic progressors (ΔmSASSS ≥2) and non-progressors (ΔmSASSS = 0). Patients' disease activity was determined using C-reactive protein (CRP), Erythrocyte Sedimentation Rate (ESR), Ankylosing Spondylitis Disease Activity Score (ASDAS), Bath Ankylosing Spondylitis Functional Index (BASFI), Bath Ankylosing Spondylitis Activity Disease Activity Index (BASDAI) and physician global assessment (MDGA). The plasma proteome was profiled using the mass spectrometry method and statistical analysis was adjusted for CRP. All patients were naïve to b/ts DMARDs during the 2-year follow-up.
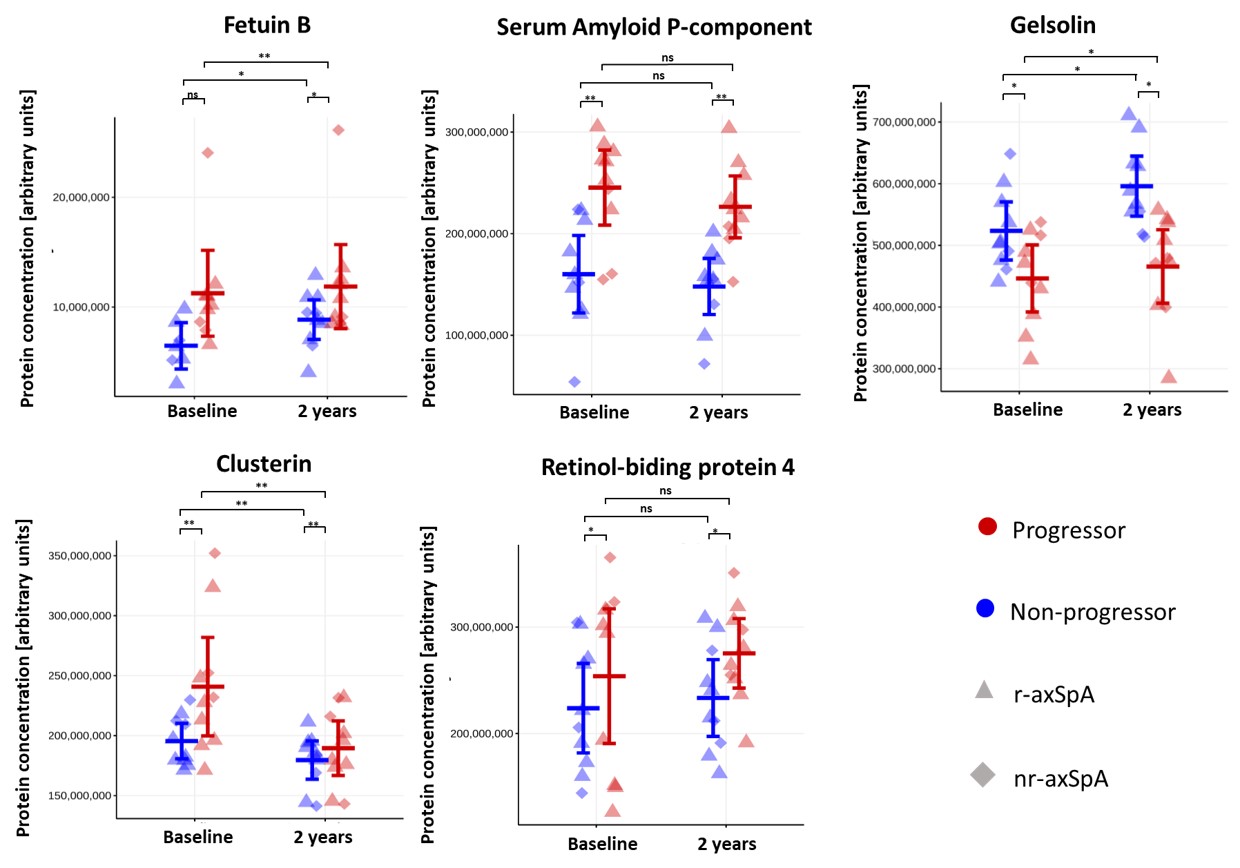
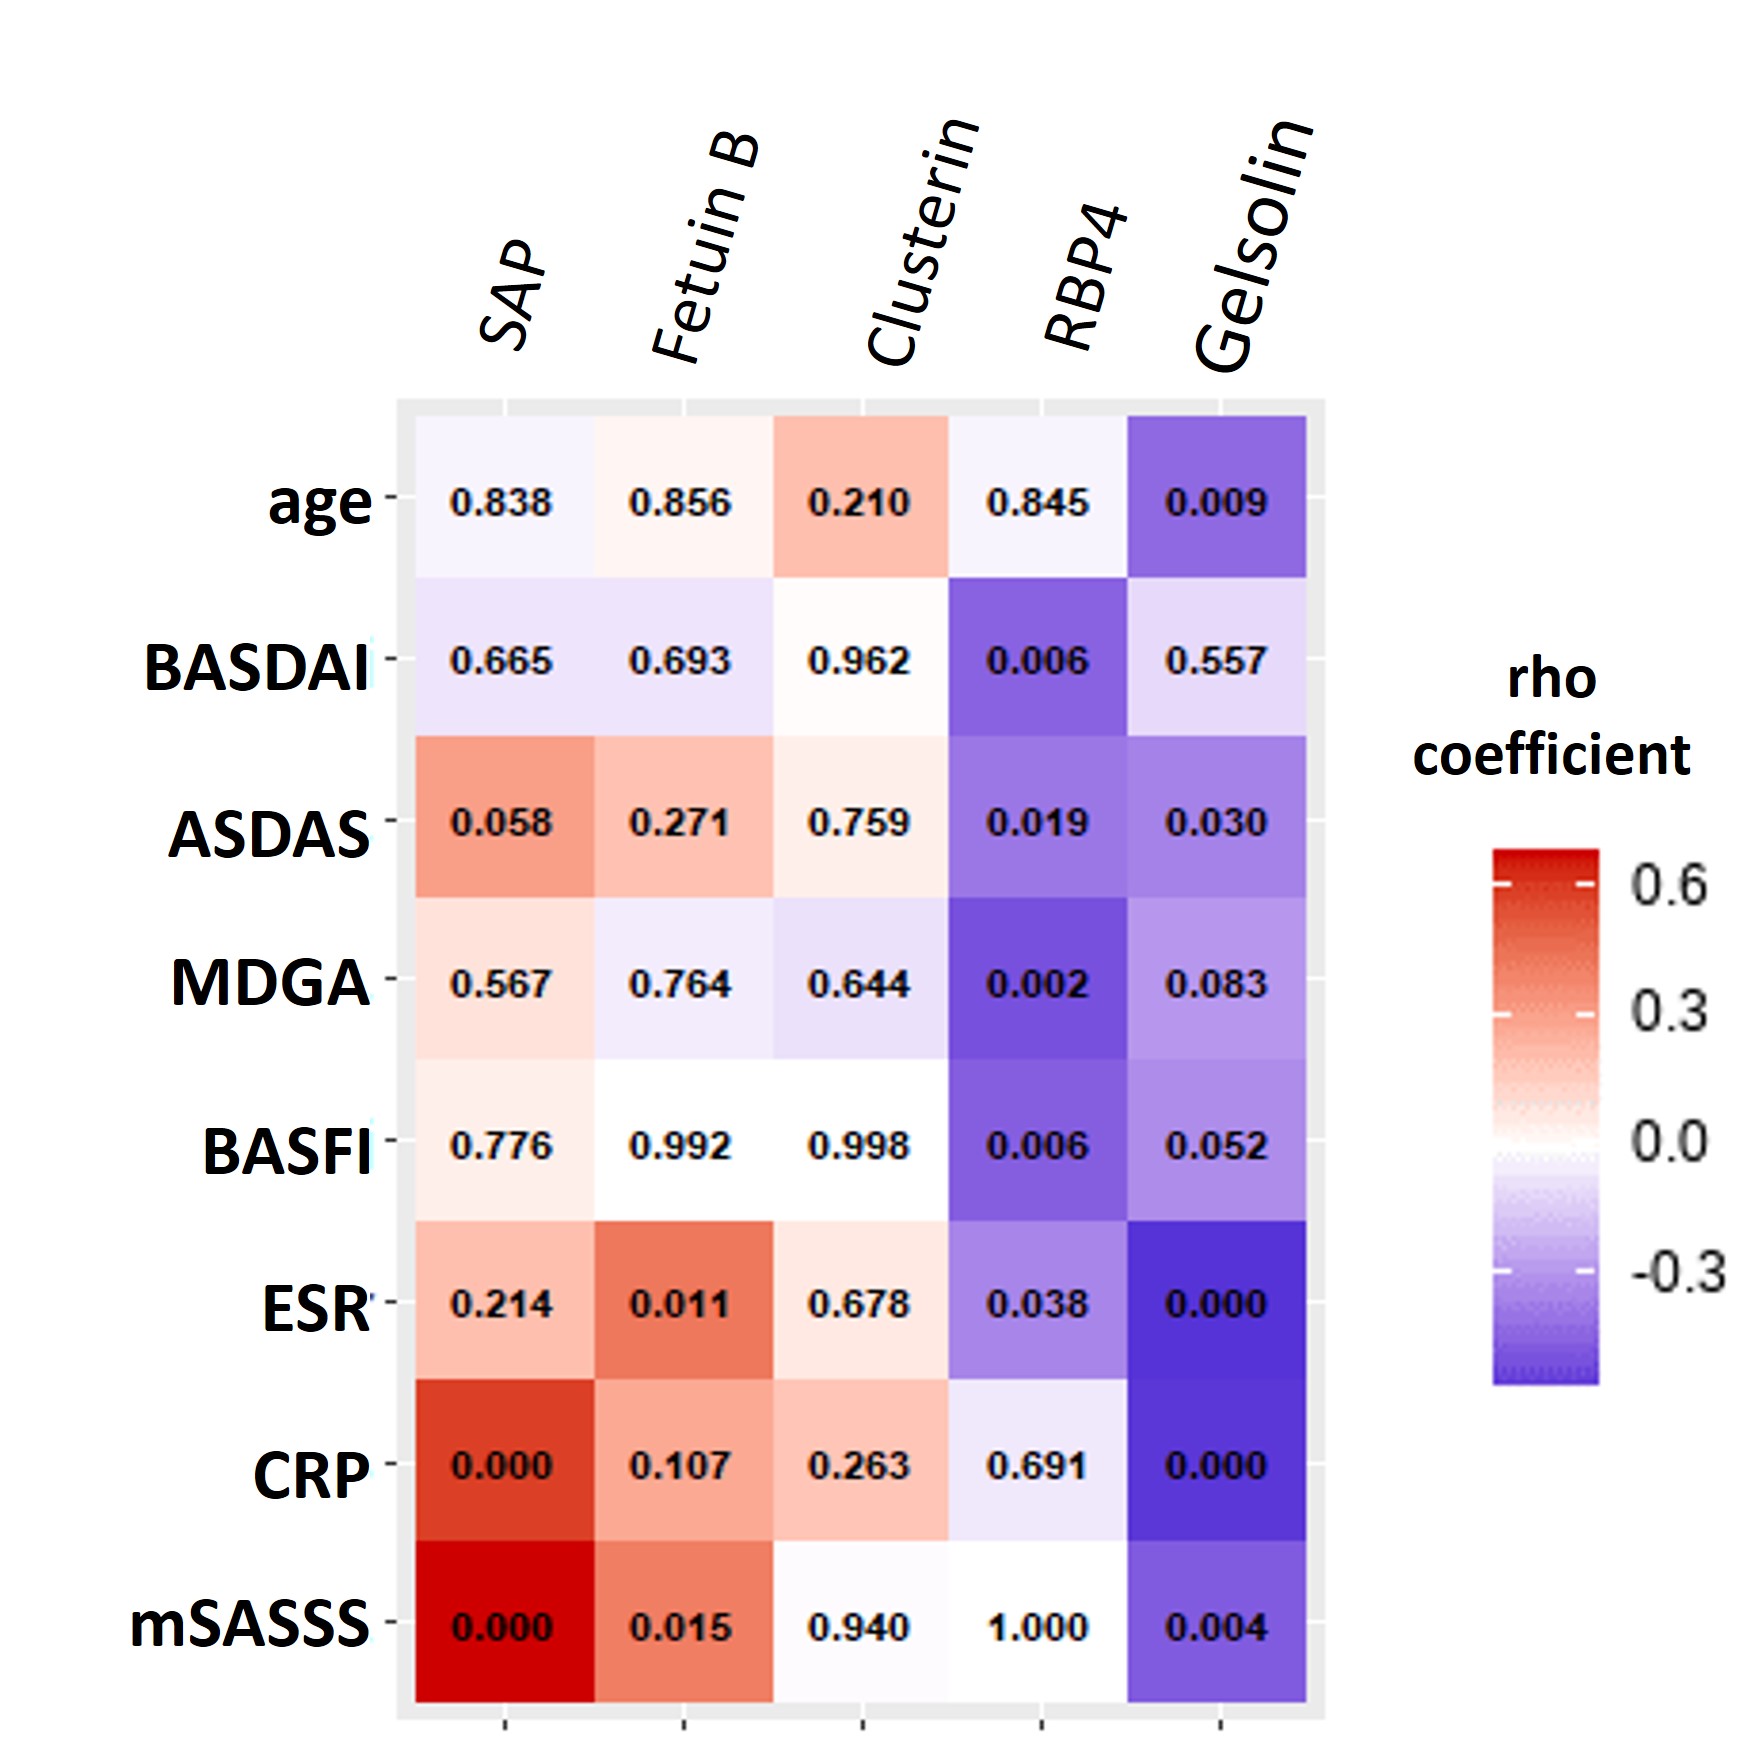
Results: Our cohort included ten patients without radiographic spinal progression (non-progressors) and ten patients who developed significant progression after two years (progressors) (mean±SD ΔmSASSS 9.88±5.1). All demographic and clinical characteristics are provided in Table 1. The profiling of plasma proteome revealed 489 quantifiable proteins, out of which 21 proteins were different between patient groups (ANOVA-computed p< 0.05 for all). The follow-up pairwise comparison revealed five promising biomarkers, out of which clusterin (1.20-fold, p=0.011), serum amyloid P-component (SAP) (1.43-fold, p< 0.004), retinol-binding protein 4 (RPB4) (1.28-fold, p=0.027), and fetuin-B (1.52-fold, p=0.051) were upregulated, while gelsolin (1.16-fold, p = 0.015) was downregulated in patients with mSASSS progression compared to those without progression (Fig. 1). Out of these proteins, gelsolin, RBP4, fetuin-B, and SAP significantly correlated with mSASSS, CRP or ASDAS (Fig. 2). All candidate proteins have previously been associated with rheumatic diseases.
Conclusion: This pilot study revealed five plasma proteins, which are likely to predict the structural progression of axSpA after two years. These data will be validated in an extended larger cohort.
Acknowledgements: Supported by SVV 260 523, BBMRI-CZ LM2018125, and MHCR No. 023728.
Figure 1 – Five candidate proteins with the potential to predict radiographic progression in axSpA. The error bars represent 95% confidence intervals with the mean for patients with or without mSASSS progression. p-values show statistical significance between depicted pairwise comparisons computed from linear mixed-effect models and adjusted for CRP. (***, p < 0.001; *, p < 0.05; ns, non-significant). Patients with and without mSASSS progression are coloured in red and blue, respectively, and radiographic (r-) and non-radiographic (nr-) axSpA patients are depicted as triangles and diamonds, respectively.
Figure 2 – Correlation matrix of five candidate proteins and selected clinical parameters. The matrix includes p-values and the colour indicates the strength and direction of Spearman’s coefficient (rho).
J. Baloun: None; K. Bubova: None; A. Pekacova: None; L. Ondrejcakova: None; V. Cervenak: None; M. Gregova: None; S. Forejtova: None; J. Horinkova: None; J. Gatterova: None; M. Tomcik: None; J. Vencovsky: Argenx, 2, Eli Lilly, 6, Galapagos, 2, Horizon, 2, Merck, 2; K. Pavelka: Abbvie, 2, 6, Amgen, 2, 6, Bristol-Myers Squibb(BMS), 2, 6, Egis, 2, 6, MSD, 2, 6, Pfizer, 2, 6, Roche, 2, 6, UCB, 2, 6; L. Senolt: None.