University of Oklahoma Health Sciences Center Oklahoma City, OK, United States
Disclosure information not submitted.
Kevin Thomas1, Miles Smith1, Carla Guthridge1, Nicolas Dominguez1, Susan Macwana1, Wade DeJager1, Catriona Wagner1, Peter Schafer2, Stan Kamp1, Betty Diamond3, David Wofsy4, Aikaterini Thanou5, Cristina Arriens6, Cynthia Aranow3, Joan Merrill1, Judith James1 and Joel Guthridge1, 1Oklahoma Medical Research Foundation, Oklahoma City, OK, 2Bristol Myers Squibb, Belle Mead, NJ, 3Feinstein Institutes for Medical Research, Manhasset, NY, 4University of California San Francisco, San Francisco, CA, 5University of Oklahoma Health, Edmond, OK, 6Oklahoma Medical Research Foundation and University of Oklahoma Health Sciences Center, Department of Arthritis & Clinical Immunology, Oklahoma City, OK
Background/Purpose: Abatacept (ABA) is a fusion protein that disrupts T cell co-stimulation by inhibiting interactions between CD28 and CD80/86. ABA is effective in RA, but SLE clinical trials have been disappointing. Exploratory analyses have suggested that ABA might benefit some SLE patients depending on disease severity or outcome definitions, but identification of reproducible predictors of response remains elusive. This study applied a systems-based approach to developing a predictive model of abatacept response in SLE.
Methods: Pre-treatment peripheral blood mononuclear cells were obtained from the screening visits of the Clarification of Abatacept Effects in SLE with Integrated Biologic and Clinical Approaches (ABC; n=19) and the Abatacept and Cyclophosphamide Combination Therapy for Lupus Nephritis (ACCESS; n=40) clinical trials evaluating ABA in SLE patients without organ-threatening disease or lupus nephritis, respectively. Genomic DNA and total RNA were extracted from isolated T cells, B cells, and monocytes, followed by DNA methylation microarray and RNA sequencing analyses. Machine learning was applied to methylation data using generalized linear modeling and 40 bootstrapped re-samplings split between 70% training and 30% testing.
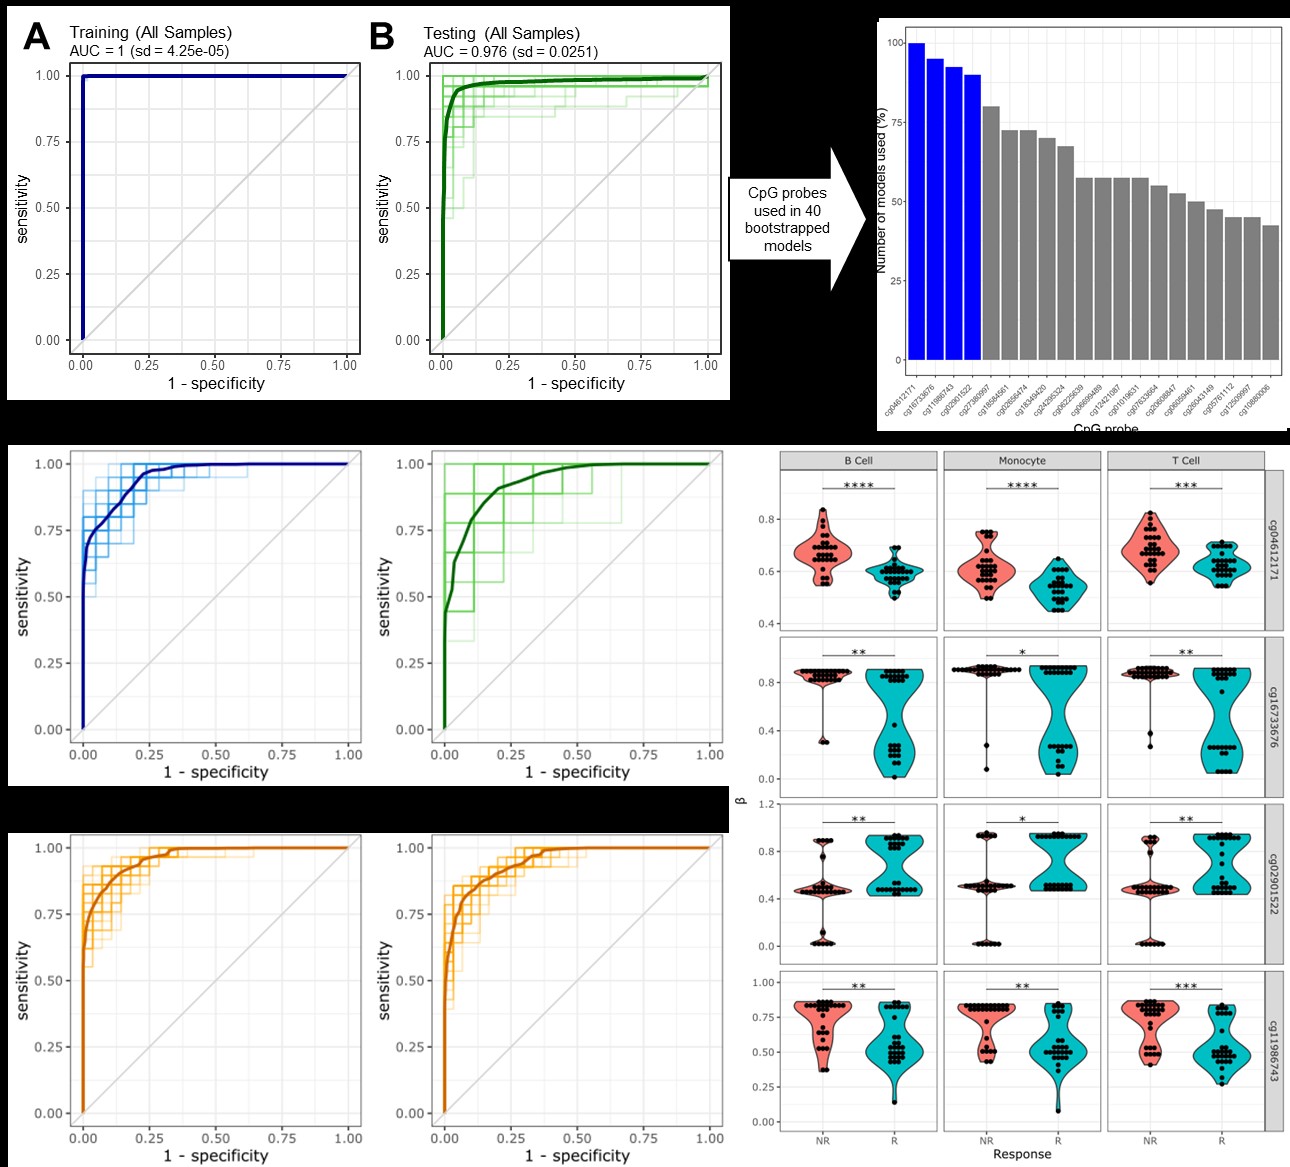
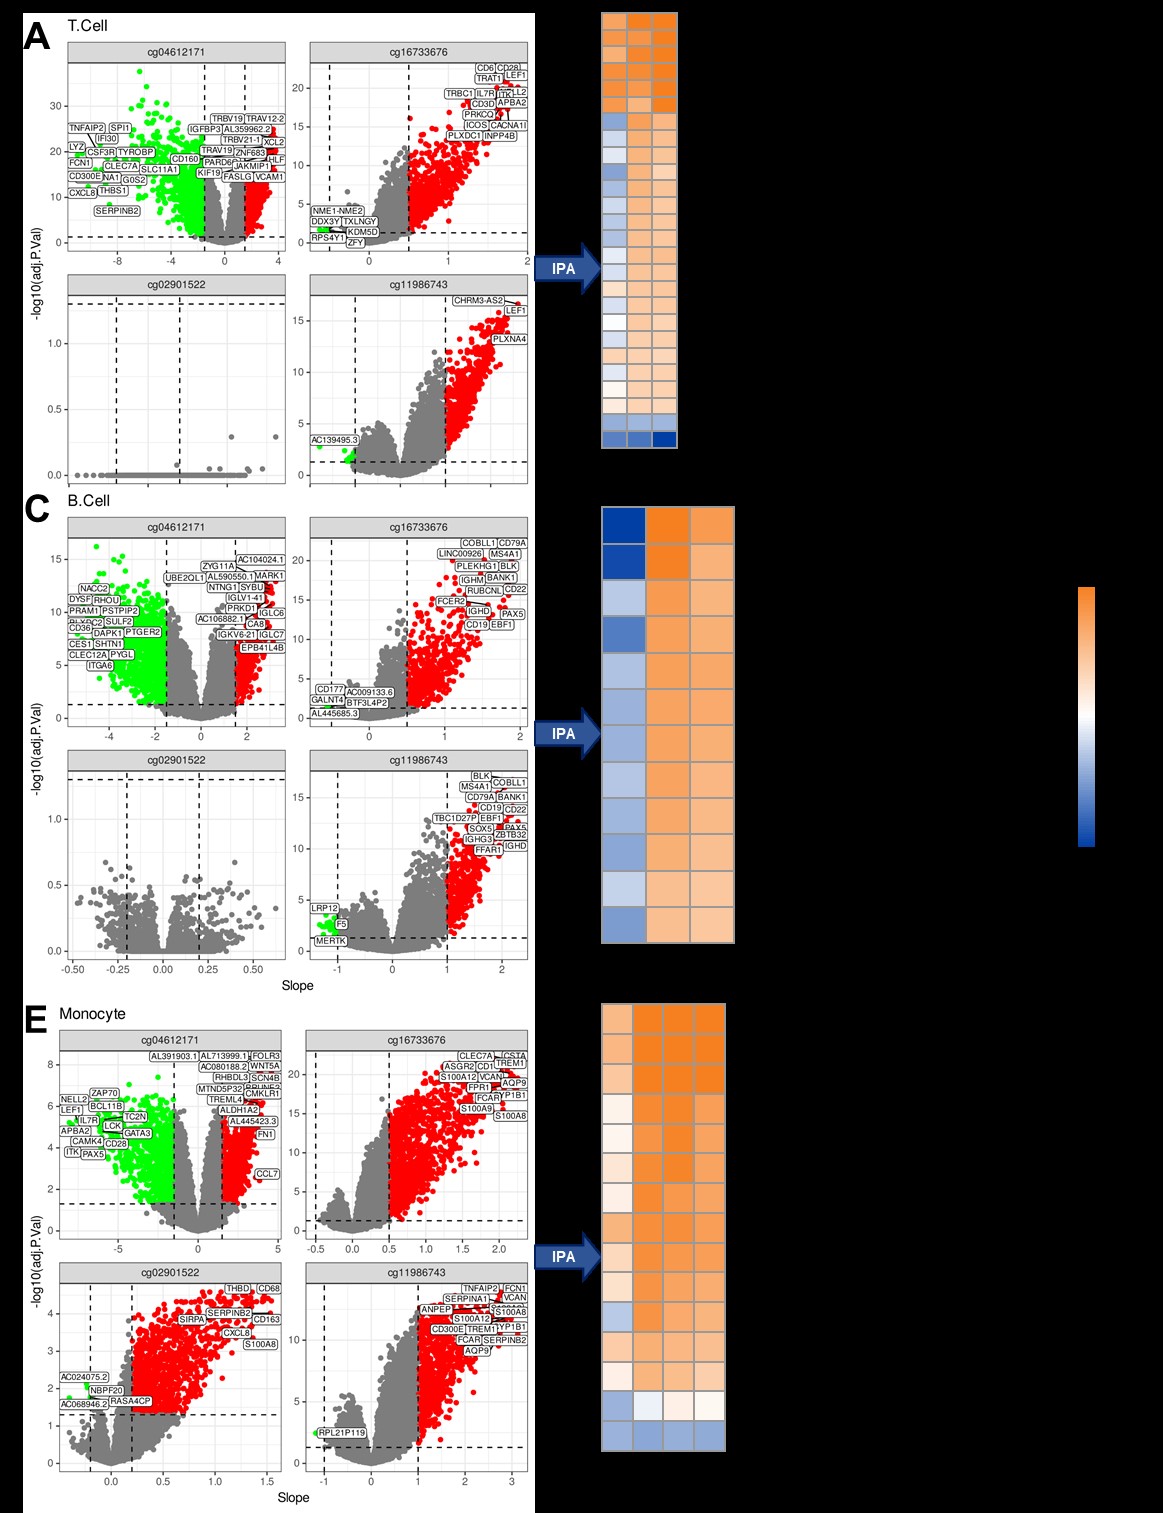
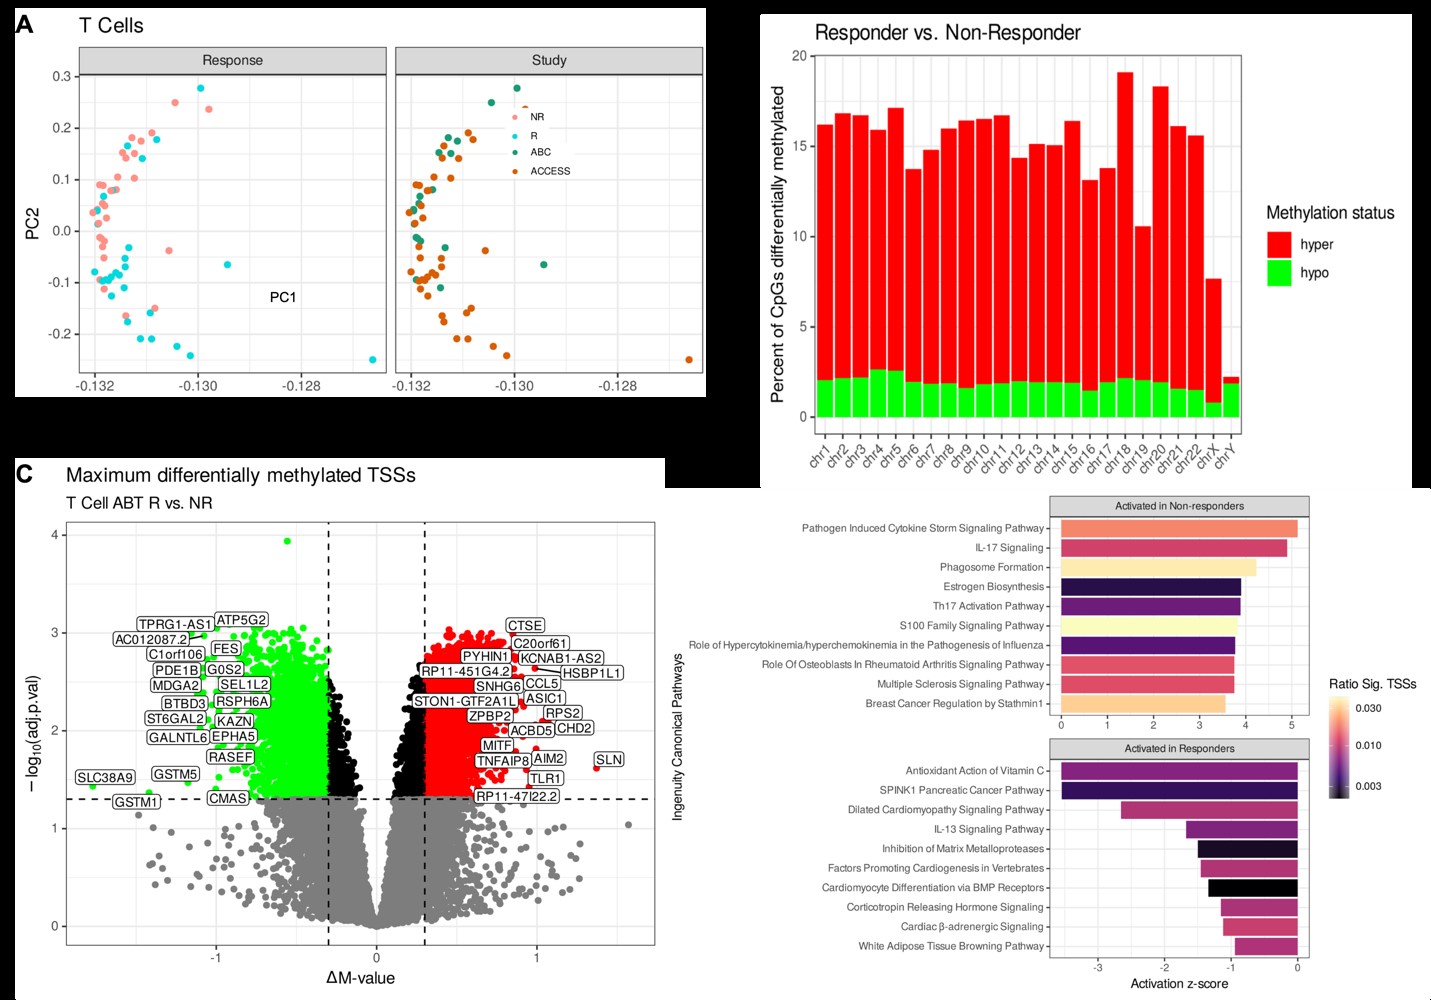
Results: A total of 29 ABA responders (R) and 30 non-responders (NR) were identified from both clinical trials. Bootstrapped models of all cell types separated responders and non-responders robustly, with an average AUC of 0.976 (Fig 1A-B). Four CpGs were shared in at least 80% of the re-samplings (Fig 1C), and a model using these 4 CpGs on T cells alone revealed an average ROC of 0.935 (Fig. 1D-E). Applying this model to B cells and monocytes yielded similarly robust results (Fig. 1F-G), and the 4 CpGs were differentially methylated in each cell type (Fig. 1H). In T cells, the 4 CpGs positively correlated with TCR activation, CTLA-4 regulation, and IL-2 production (Fig 2A-B), while BCR activity and phagosome activity and cytokine production are correlated with these CpGs in B cells and monocytes, respectively (Fig 2C-F). Unbiased principal component analysis on global T cell methylation profiles separated R and NR patients (Fig 3A), and most sites were hypermethylated in R patients (Fig 3C). The most hypermethylated transcription start sites revealed associations with cytokine storm and IL-17 signaling in NR patients (Fig 3D-E).
Conclusion: We determined a robust 4 CpG methylation signature that predicts ABA response across two disparate SLE trials. Parallel transcriptomic profiling linked this signature to cell lineage-specific activation pathways. Comparative epigenomic analysis of T cells revealed a hypomethylated signature in NR patients, likely driving continued proinflammatory responses despite abatacept treatment.
Figure 1. Machine learning identifies a 4-marker methylation signature distinguishing abatacept responders and non-responders at screening. ROC curves of 40 bootstrapped re-samplings of all cell type-specific epigenome profiles split between (A) 70% training and (B) 30% testing. (C) Percent of models using each of the top 20 most frequently utilized features across the models. (D-E) ROC curves of 40 bootstrapped re-samplings of T cell epigenome profiles. Models were developed with only the top 4 CpGs. (F-G) ROC curves of 40 models developed on T cells applied to B cells and monocytes. (H) Violin dot plots of methylation differences () by abatacept response of the top 4 CpGs. Asterisks indicate significance of Benjamini-Hochberg corrected p-value of Mann-Whitney U-Tests: * < 0.05, ** < 0.01, *** < 0.001, **** < 0.0001.
Figure 2. Correlation of RNA transcripts with methylation at CpGs predictive of abatacept response. Volcano plots and ingenuity pathway analysis (IPA) results of correlation analyses of methylation at each of the 4 predictive CpGs with RNA-seq data in (A-B) T cells, (C-D) B cells, and (E-F) monocytes. (A, C, E) The slope of each correlation is plotted on the x-axis, and the negative log transforms of p-values adjusted for multiple comparisons on the y-axis. (B, D, F) The most significantly correlated transcripts at each CpG of interest were input into IPA with previously noted cutoffs.
Figure 3. Global epigenetic landscape of T cells contributing to future abatacept response. (A) Principal component analyses of global DNA methylation profiles of T cells. (B) Bar graph of per-chromosome methylation comparison between T cells from abatacept responders and non-responders. (C) Volcano plot of maximum differential methylation at transcription start sites for annotated genes between T cells from abatacept responders and non-responders. (D) Bar graph of the top 10 canonical pathways from IPA by predicted activation in abatacept responders and non-responders. IPA results were filtered for Benjamini-Hochberg adjusted p-value < 0.05 by Fisher’s exact test and selected for the top 10 positive and negative activation z-scores.
K. Thomas: None; M. Smith: None; C. Guthridge: None; N. Dominguez: None; S. Macwana: None; W. DeJager: None; C. Wagner: None; P. Schafer: Bristol Myers Squibb, 3, 10, 11; S. Kamp: None; B. Diamond: Alpine, 12, DSMB, DBV, 2, 2, IMT, 2, Kyverna, 2, Nighthawk, 2, ONO, 2; D. Wofsy: Amgen, 7, Novartis, 7; A. Thanou: None; C. Arriens: AstraZeneca, 1, 5, 6, Aurinia, 6, Bristol-Myers Squibb, 1, 5, Cabaletta, 1, GSK, 1, Kezar, 1, UCB, 1; C. Aranow: AstraZeneca, 2, Bristol-Myers Squibb(BMS), 2, GlaxoSmithKlein(GSK), 2, 5, kezar Inc, 2; J. Merrill: AbbVie, 2, Alexion, 2, Alumis, 2, Amgen, 2, AstraZeneca, 2, 5, Aurinia, 2, Bristol Myers Squibb, 2, 5, EMD Serono, 2, Genentech, 2, Gilead, 2, GlaxoSmithKline, 2, 5, Lilly, 2, Merck, 2, Pfizer, 2, Provention, 2, Remegen, 2, Sanofi, 2, UCB Pharma, 2, Zenas, 2; J. James: Bristol-Myers Squibb(BMS), 5, GlaxoSmithKlein(GSK), 2, Novartis, 2, Progentec Biosciences, 5; J. Guthridge: None.