University of California San Diego La Jolla, CA, United States
Disclosure information not submitted.
Jessica Murillo-Saich1, Roxana Coras2, Felipe Julio Ramirez Garcia3, Estefania Quesada-Masachs4, Marta Sala Climent5, Katharina Eschelbach4, Christopher Mahony6, Raquel Celis7, Aaron Armando8, Oswald Quehenberger8, Adam Croft6, Arthur Kavanaugh9, Eric Chang5, Juan D Canete10, Abha Singh1 and Monica Guma11, 1Department of Medicine, University of California San Diego, La Jolla, CA, 2Cedars-Sinai Medical Center, Los Angeles, CA, 3Hospital Clínic, Barcelona, Spain, 4La Jolla Institute for Immunology, La Jolla, CA, 5University of California San Diego, San Diego, CA, 6University of Birmingham, Birmingham, United Kingdom, 7Arthritis Unit, Rheumatology Department, Hospital Clinic and IDIBAPS, Barcelona, Spain, 8Department of Pharmacology, University of California San Diego, La Jolla, CA, 9University of California San Diego, School of Medicine, Riverside, CA, 10Hospital Clinic an IDIBAPS, Barcelona, Spain, 11San Diego VA Healthcare Service, La Jolla, CA
Background/Purpose: Oxylipins are bioactive lipids derived from polyunsaturated fatty acids (PUFAs) that modulate inflammation and may remain overexpressed in refractory synovitis. These mediators in plasma could also be biomarkers of synovial pathology. The aim of this study is to determine synovial oxylipins in active inflamed joints and their correlation with plasma oxylipins.
Methods: Patients with established rheumatoid or psoriatic arthritis with active disease despite treatment were recruited and paired synovial tissue (ST) and plasma were collected. Oxylipins were determined by liquid chromatography with tandem mass spectrometry and were classified into groups according to their PUFA precursor and enzyme. The expression of CD20, CD68, CD3 and CD138 were obtained to describe synovial histology. Cell specific expressions of oxylipin-related genes were identified by examining available synovial scRNA-seq data.
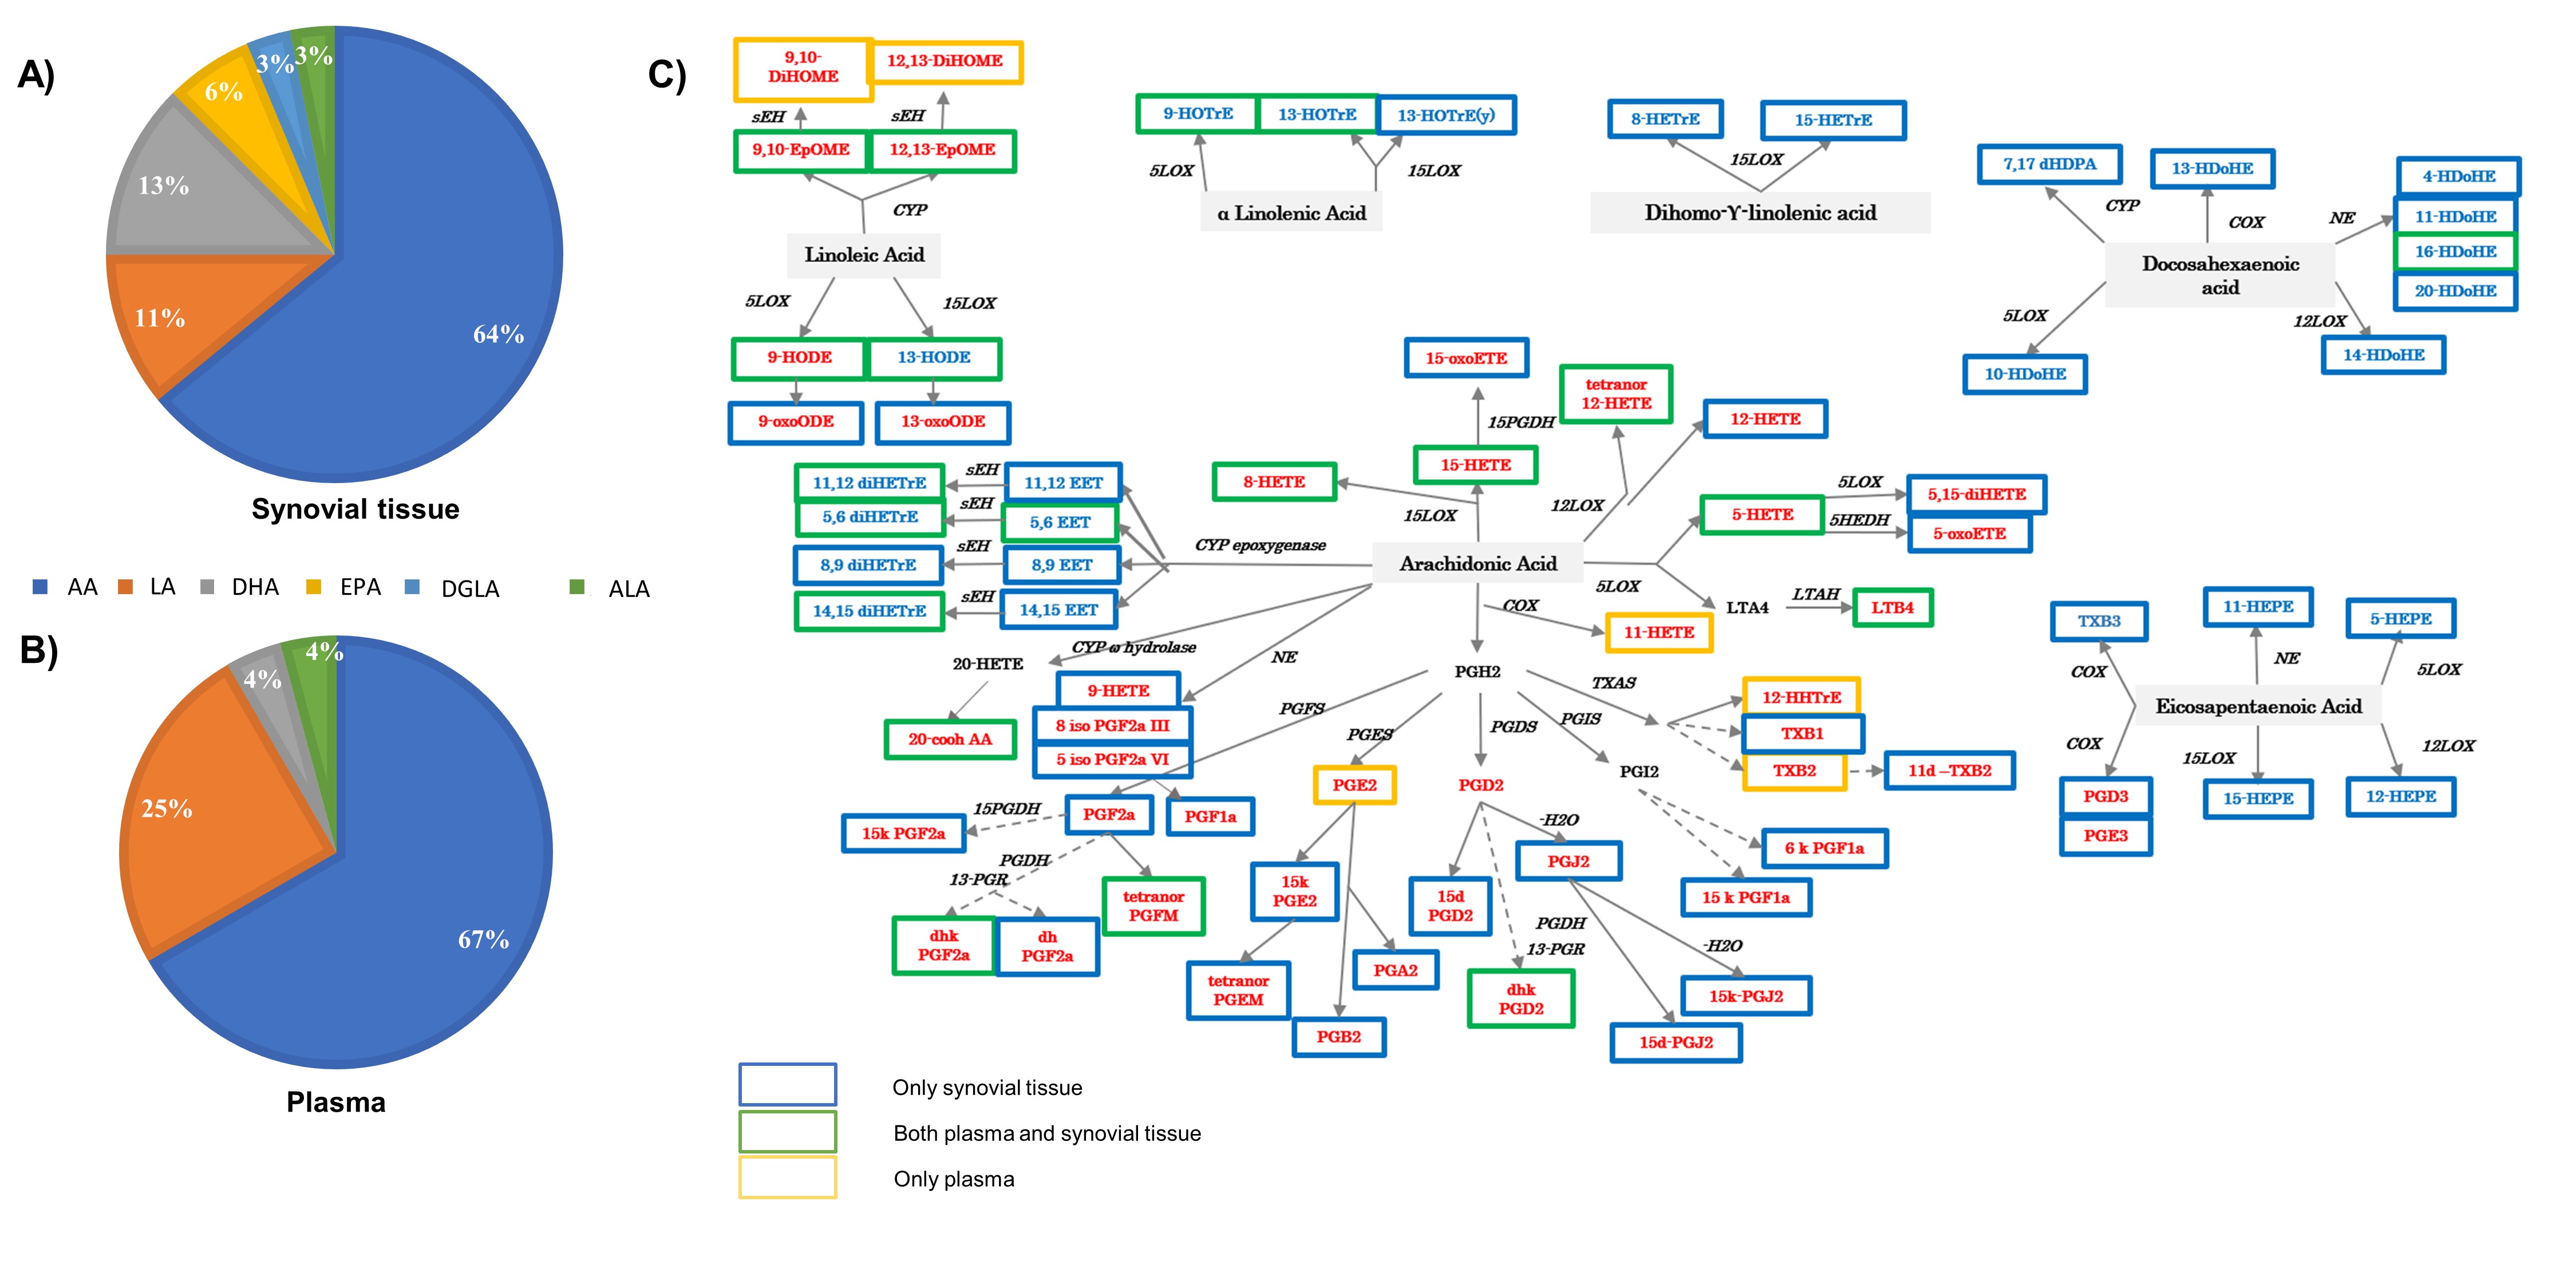
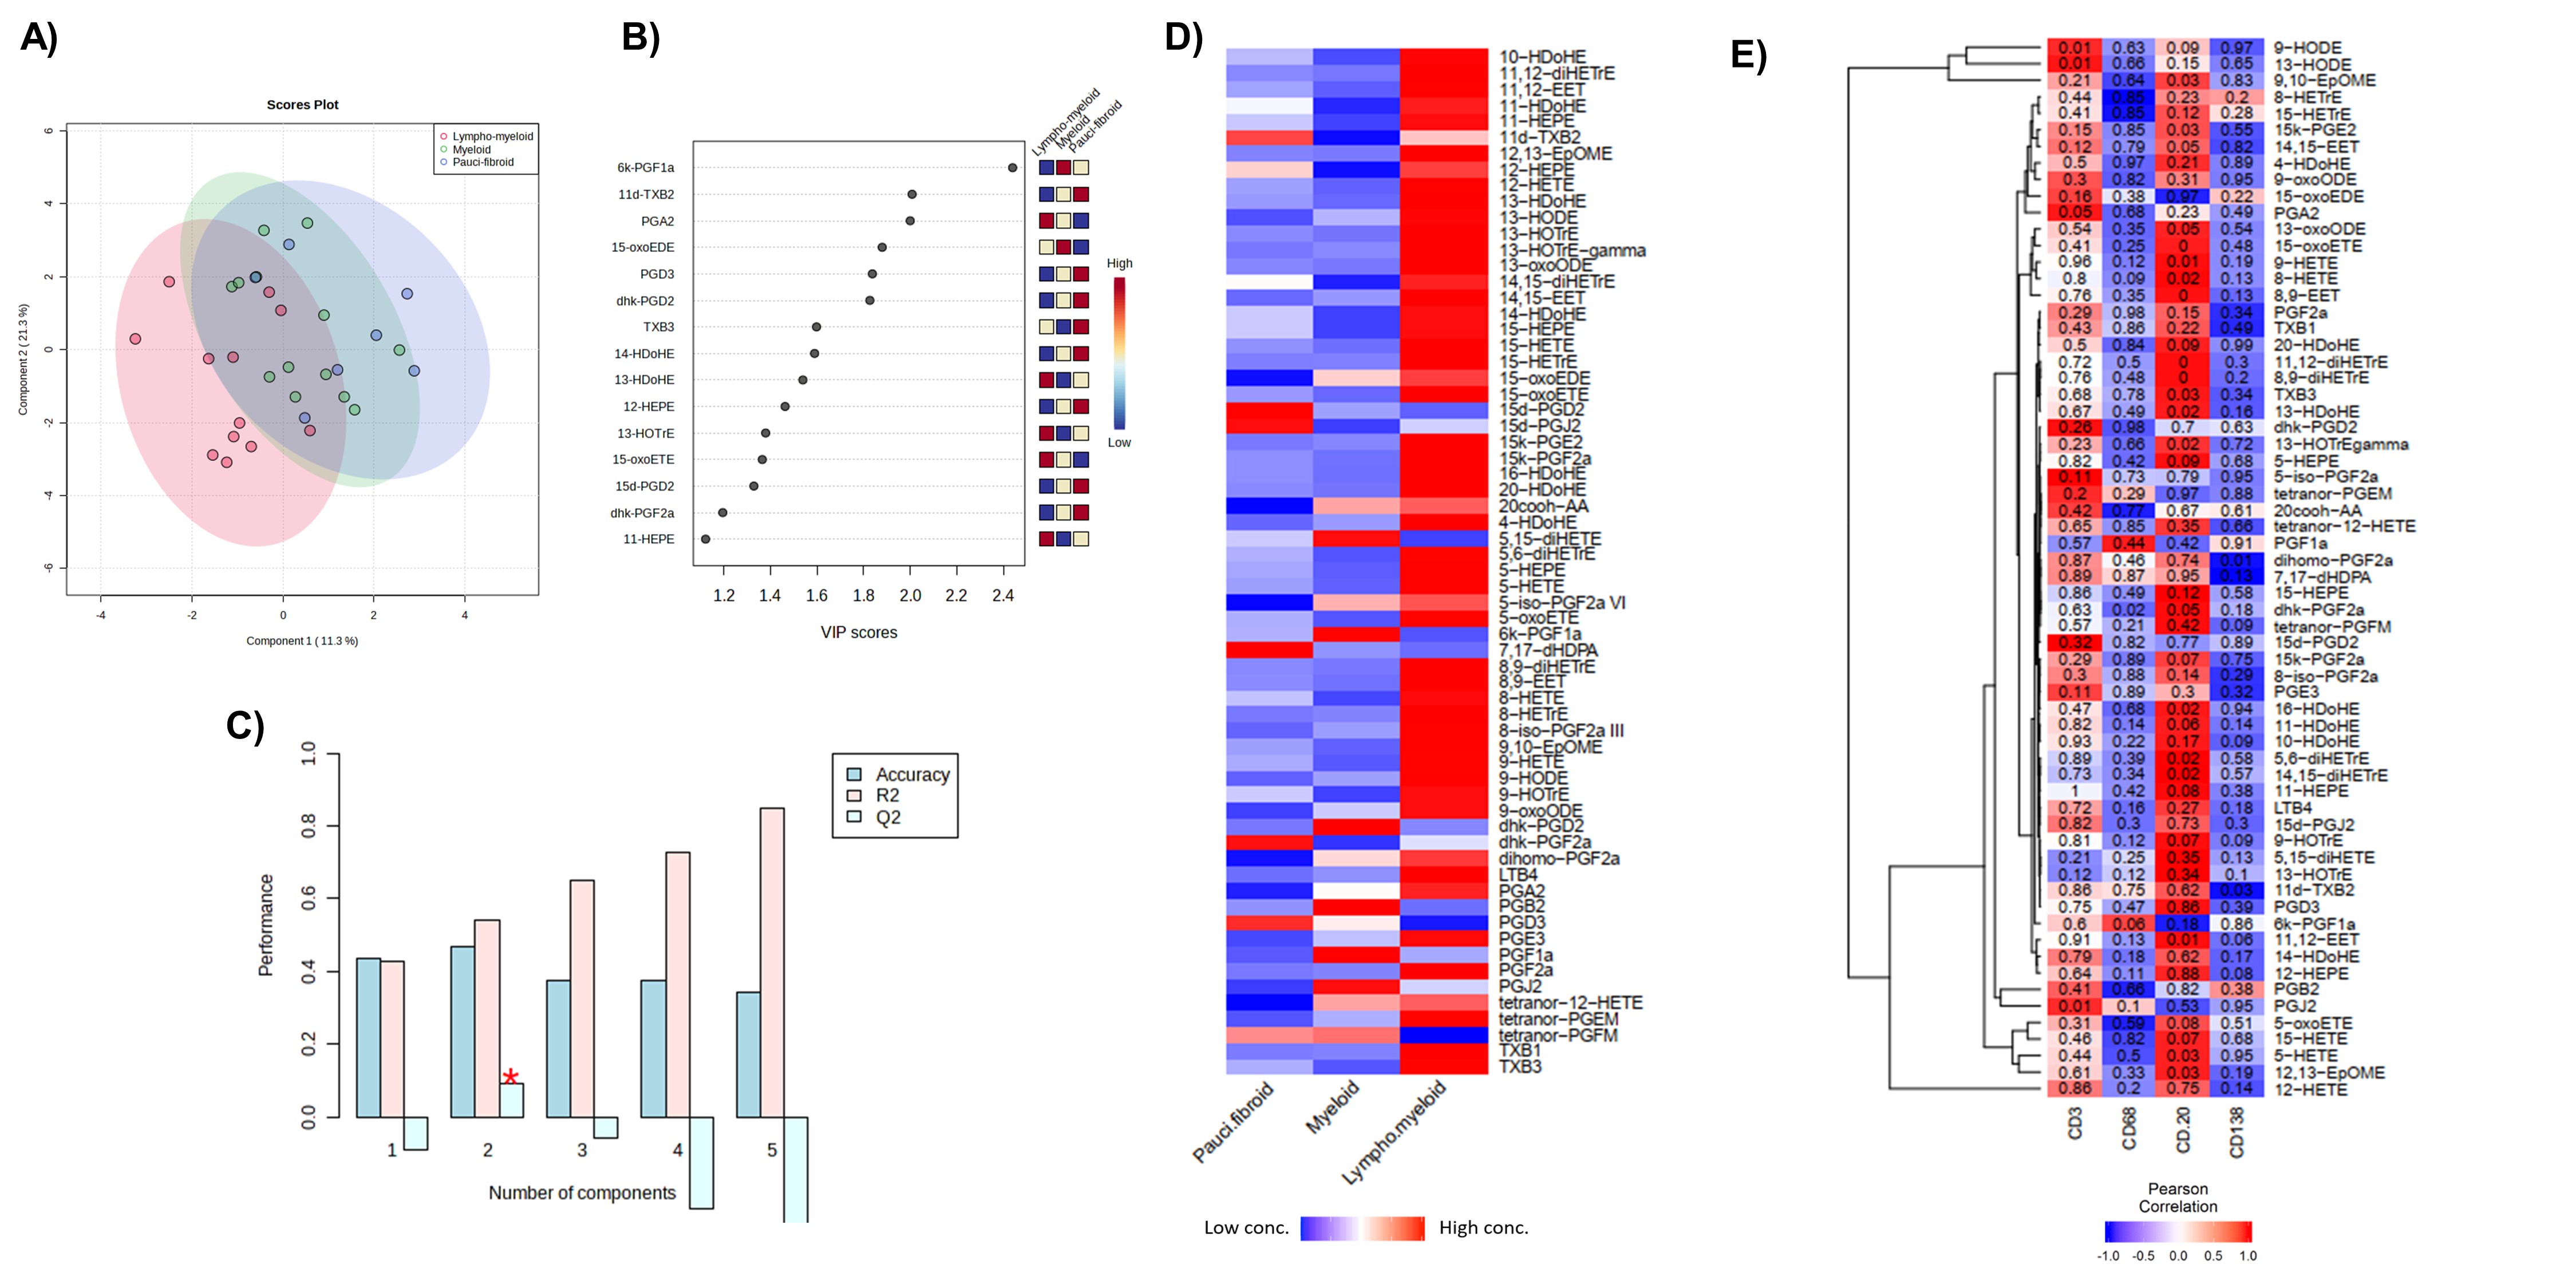
Results: We included a total of 32 ST and 26 paired-plasma samples. A total of 64 oxylipins were identified in ST but only 28 were identified in plasma (Figure 1). Only levels of 11,12-di-HETrE, 15-HETE, 16-HDoHE and tetranor-PGFM had a statistically significant positive correlation between plasma and ST. Multivariate approaches were conducted to capture the global picture of oxylipins disturbances according to the histological classification. Although PLS-DA with the identified metabolites in the tissue showed some overlap between the 3 groups (Figure 2A),6k-PGF1a, 11d-TXB2 and PGA2 were the most important metabolites in component 2 to discriminate between the three groups with a VIP score >2 (Figure 2B). This component showed a positive predictive ability to separate the three phenotypes with an accuracy= 0.47, R2= 0.54 and Q2= 0.09 (Figure 2C). We found higher concentration of several oxylipins in the lymphoid-myeloid phenotype (Figure 2D) which a positive correlation with CD3 and CD20 semiquantification (Figure 2E). Several oxylipins and oxylipin-related genes were differentially expressed among synovial phenotypes. Specifically, several 5-LOX-derived oxylipins were statistically elevated in lympho-myeloid phenotype and associated with B cells expression (Figure 3).
Conclusion: The lack of correlation between synovial tissue and plasma oxylipins suggests that synovial lipid profiling better characterizes active pathways in treated joints. Synovial 5-LOX-derived oxylipins were more highly expressed in B cell-enriched synovium, thus combination therapy with 5-LOX inhibitors to improve refractory inflammation may be needed in patients with this histological group.
Figure 1. Oxylipin profile in tissue and plasma. A-B) Pie chart representing the percentage of oxylipins grouped by precursors in tissue A) and B) plasma. C) Scheme showing the panel of oxylipins found in both tissue and plasma in a green box. The oxylipins found only in plasma are highlighted in yellow, and the oxylipins found only in synovial tissue are highlighted in blue. Pro-inflammatory oxylipins are marked in red and oxylipins associated with resolution of inflammation are marked in blue. AA: arachidonic acid; LA: linoleic acid; DHA: docosahexaenoic acid; EPA: eicosapentaenoic acid; DGLA: dihomo gamma linolenic acid; ALA: alpha-linolenic acid. The abbreviations list for oxylipin names can be found in Supplementary Table 1. COX – cyclooxygenase; LOX – lipoxygenase; CYP – cytochrome P450; NE – non-enzymatic; PGFS – prostaglandin F synthase; PGES – prostaglandin E synthase; PGDS – prostaglandin D synthase; PGIS – prostaglandin I synthase; TXAS – thromboxane A2 synthase; LTAH – leukotriene A4 hydrolase; MDB – membrane dipeptidase; HEDH - hydroxyeicosanoid dehydrogenase; PGDH - hydroxyprostaglandin dehydrogenase; 13-PGR – 15-ketoprostaglandin∆13 reductase; sEH – soluble epoxide hydrolase.
Figure 2. Discrimination between pauci-fibroid, myeloid and lympho-myeloid phenotypes in tissue. A) PLS-DA considering all samples of tissue (n=32) where is observed an overlap within the 3 phenotypes and B) VIP score obtained from the second component of PLS-DA analysis. C) Cross validation analysis using a maximum of 5 components to search and leave-one-out cross validation. Component 2 showed positive predictive ability to separate the three phenotypes with an accuracy= 0.47, R2= 0.54 and Q2= 0.09. D) Heatmap of mean concentrations of oxylipins by histological phenotypes where red is high concentration and blue shows low concentration. E) Pearson correlation adjusted by age and BMI between histological markers semi quantification and concentration of oxylipins in tissue using Euclidean distance and ward clustering algorithms where red color indicates positive strength of association while blue indicates negative correlation. P value is stated on each cell.
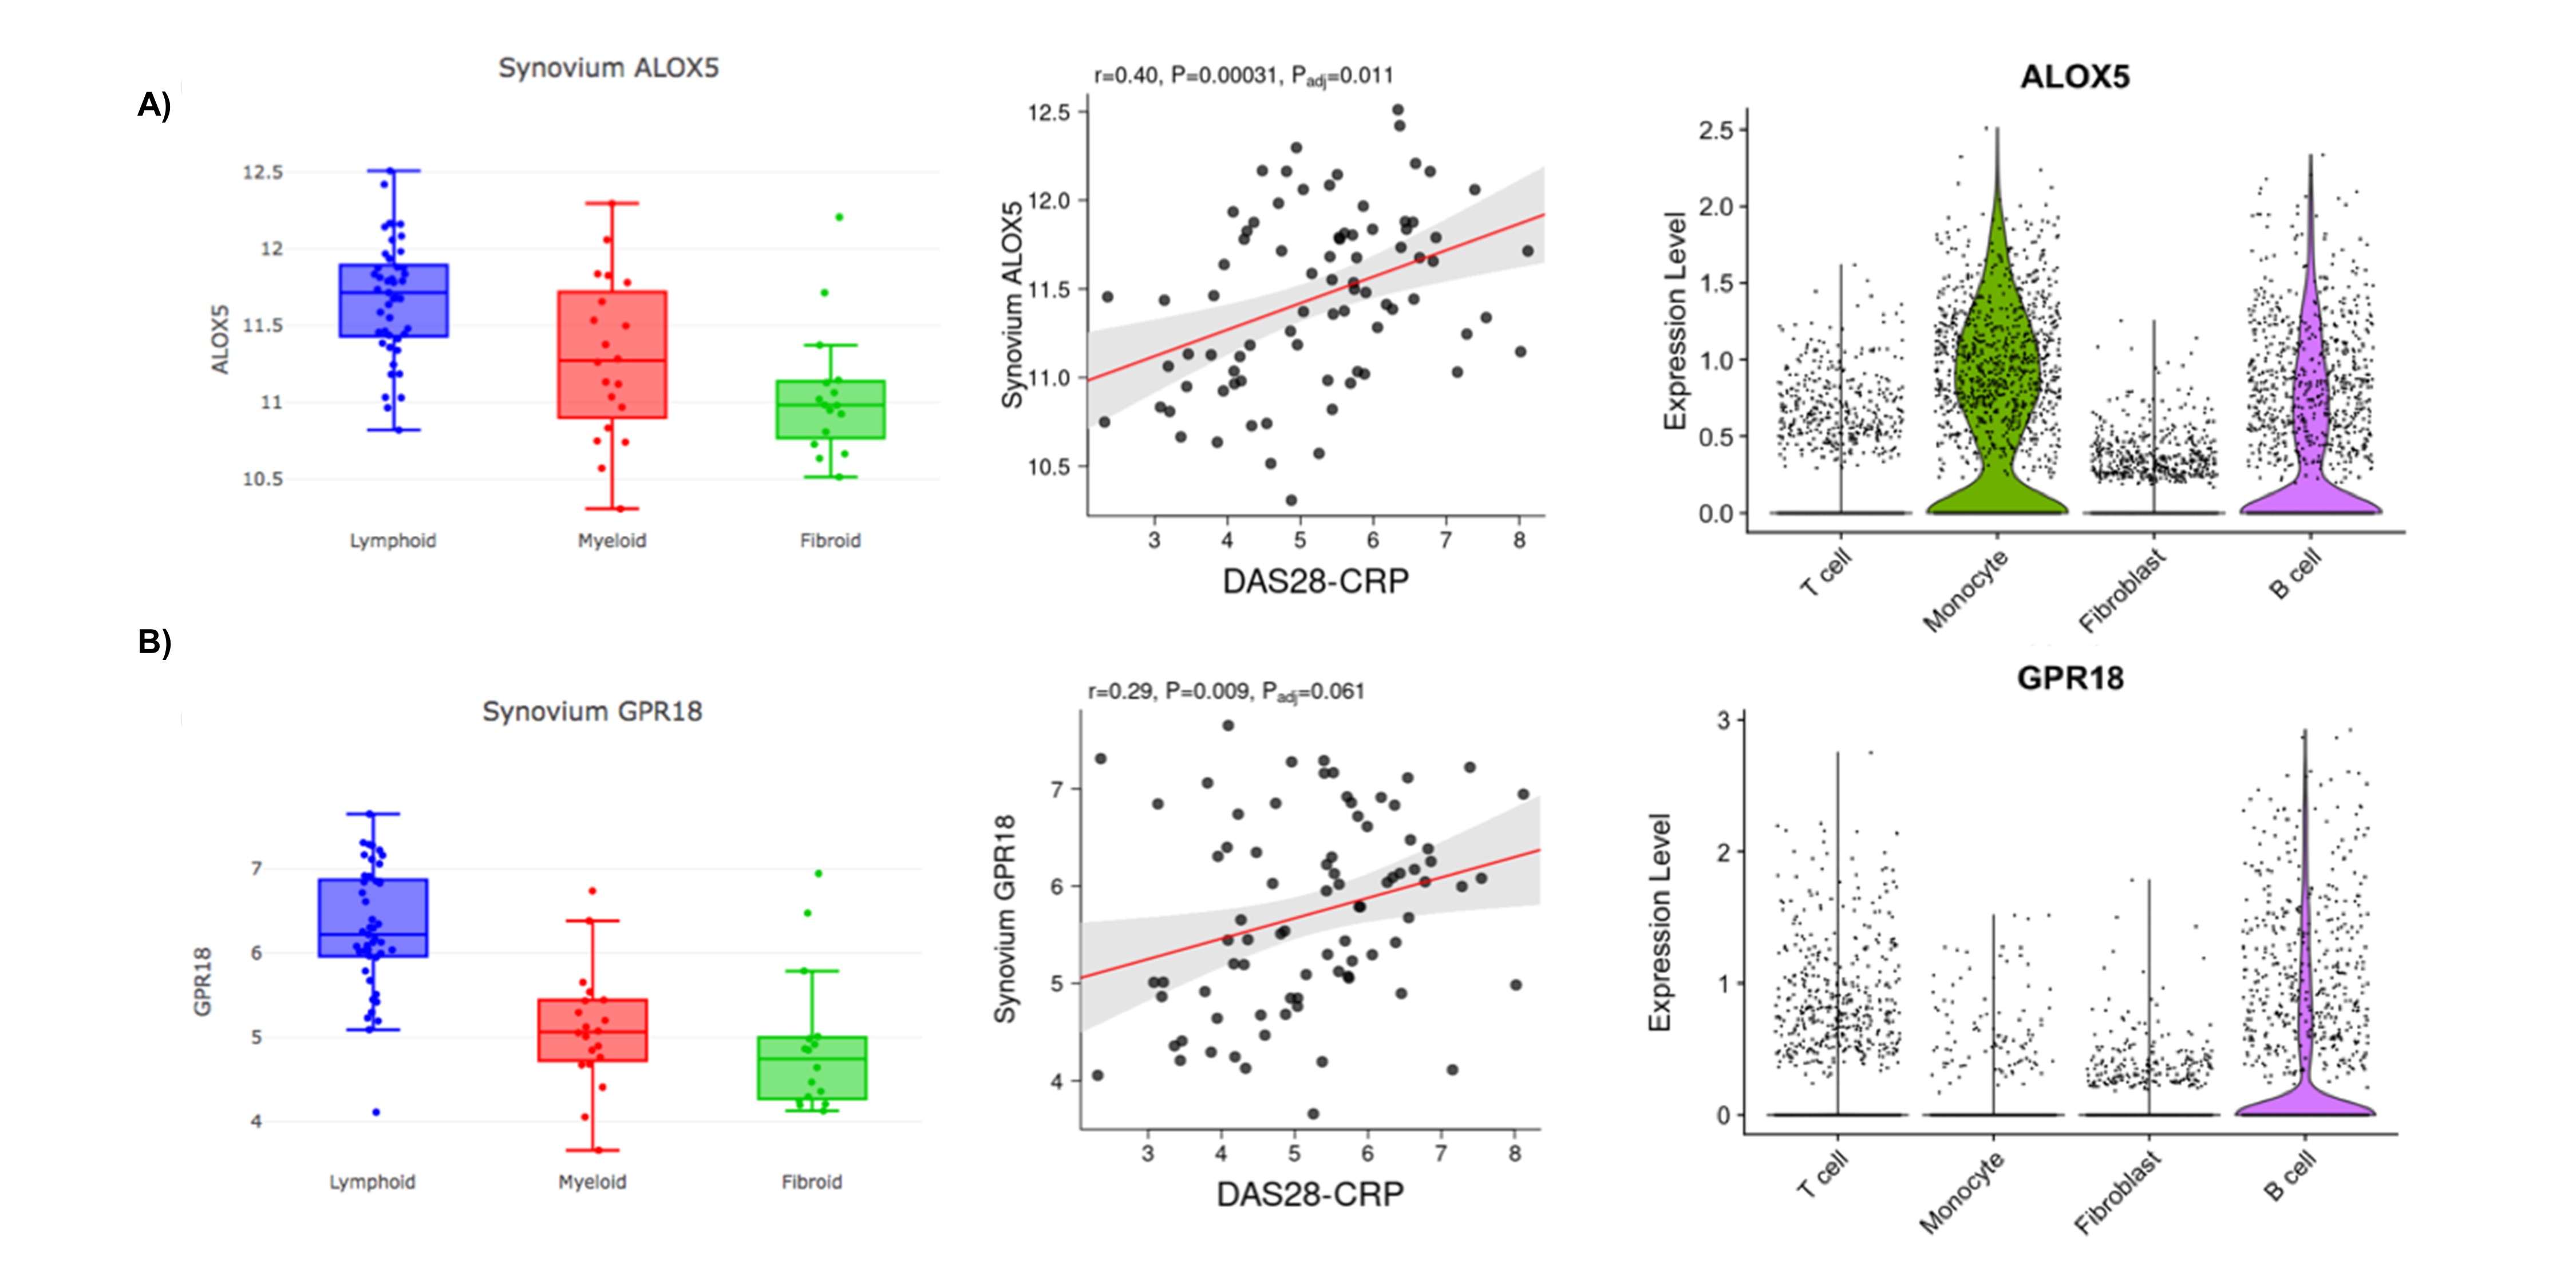
Figure 3. Synovial 5-LOX-derived oxylipins define the synovial lympho-myeloid phenotype. RNA-seq expression of 5-LOX (A) and GPR18 (B) in the different histologic phenotypes and correlation with disease activity from PEAC “gene view”, and violin plots from scRNA-seq data2. Boxplots of ALOX5 showed a higher expression in lymphoid group compared to myeloid (p= 0.009) and pauci-fibroid (p< 0.001) phenotypes and positive correlation with disease activity (r=0.40, p=0.01). In violin-plot is observed that ALOX5 was highly expressed in monocytes and B cells. GPR18 shows in boxplot higher expressed in the lymphoid group compared to myeloid (p <0.001) and pauci-fibrotic (p= <0.001), showing a tendency with a positive correlation with disease activity (r= 0.29, p= 0.06), and highly expressed in B cells observed in violin plot.
J. Murillo-Saich: None; R. Coras: None; F. Ramirez Garcia: AbbVie/Abbott, 2, 6, Amgen, 6, Eli Lilly, 6, Janssen, 6, 12, Paid Instructor, Novartis, 2, 6, 12, Paid Instructor, Pfizer, 5, 6, UCB, 2, 6; E. Quesada-Masachs: None; M. Sala Climent: None; K. Eschelbach: None; C. Mahony: None; R. Celis: None; A. Armando: None; O. Quehenberger: None; A. Croft: None; A. Kavanaugh: AbbVie, 1, 2, Amgen, 1, 2, BMS, 1, 2, Eli Lilly, 1, 2, Novartis, 1, 2, Pfizer, 1, 2, UCB, 1, 2; E. Chang: None; J. Canete: None; A. Singh: None; M. Guma: Genentech, 5, Gilead, 5, Novartis, 5, Pfizer, 5.