Session: (1442–1487) SLE – Diagnosis, Manifestations, & Outcomes Poster II
1476: Discriminating Disease Flare from Infection in Febrile Patients with Systemic Lupus Erythematosus Admitted to a Safety-Net Hospital System: A Retrospective, Multicenter Study
NYU Langone Medical Center New York, NY, United States
Disclosure information not submitted.
Abhimanyu Amarnani1, Flora Liu2, Melissa Lee Wilson2, Nathan Lim2, William Stohl3 and Leanna Wise4, 1NYU Langone Medical Center, New York, NY, 2Keck School of Medicine and LAC+USC Medical Center, Los Angeles, CA, 3University of Southern California Keck School of Medicine, Division of Rheumatology, Los Angeles, CA, 4LAC+USC/Keck Medicine of USC, Pasadena, CA
Background/Purpose: Fever in systemic lupus erythematosus (SLE) patients presents a diagnostic challenge as the differential diagnosis includes disease flare and infection. Identifying laboratory parameters to distinguish between the two is important for clinical care improvement. This study evaluates clinical laboratory parameters in febrile SLE patients admitted to three safety-net hospitals in Los Angeles for their ability to discriminate flare from infection.
Methods: Patients aged over 18 years admitted between August 1, 2016, and July 31, 2019, with a diagnosis of SLE and fever (≥38C) were reviewed for infection versus flare based on viral panels, microbial cultures, antibiotic use, discharge diagnosis, and SLEDAI-2K scores. Laboratory parameters collected within 48 hours of admission (CBC with differential, liver function panel, ESR, CRP, C3, C4, lactate, procalcitonin, and ferritin) were analyzed.
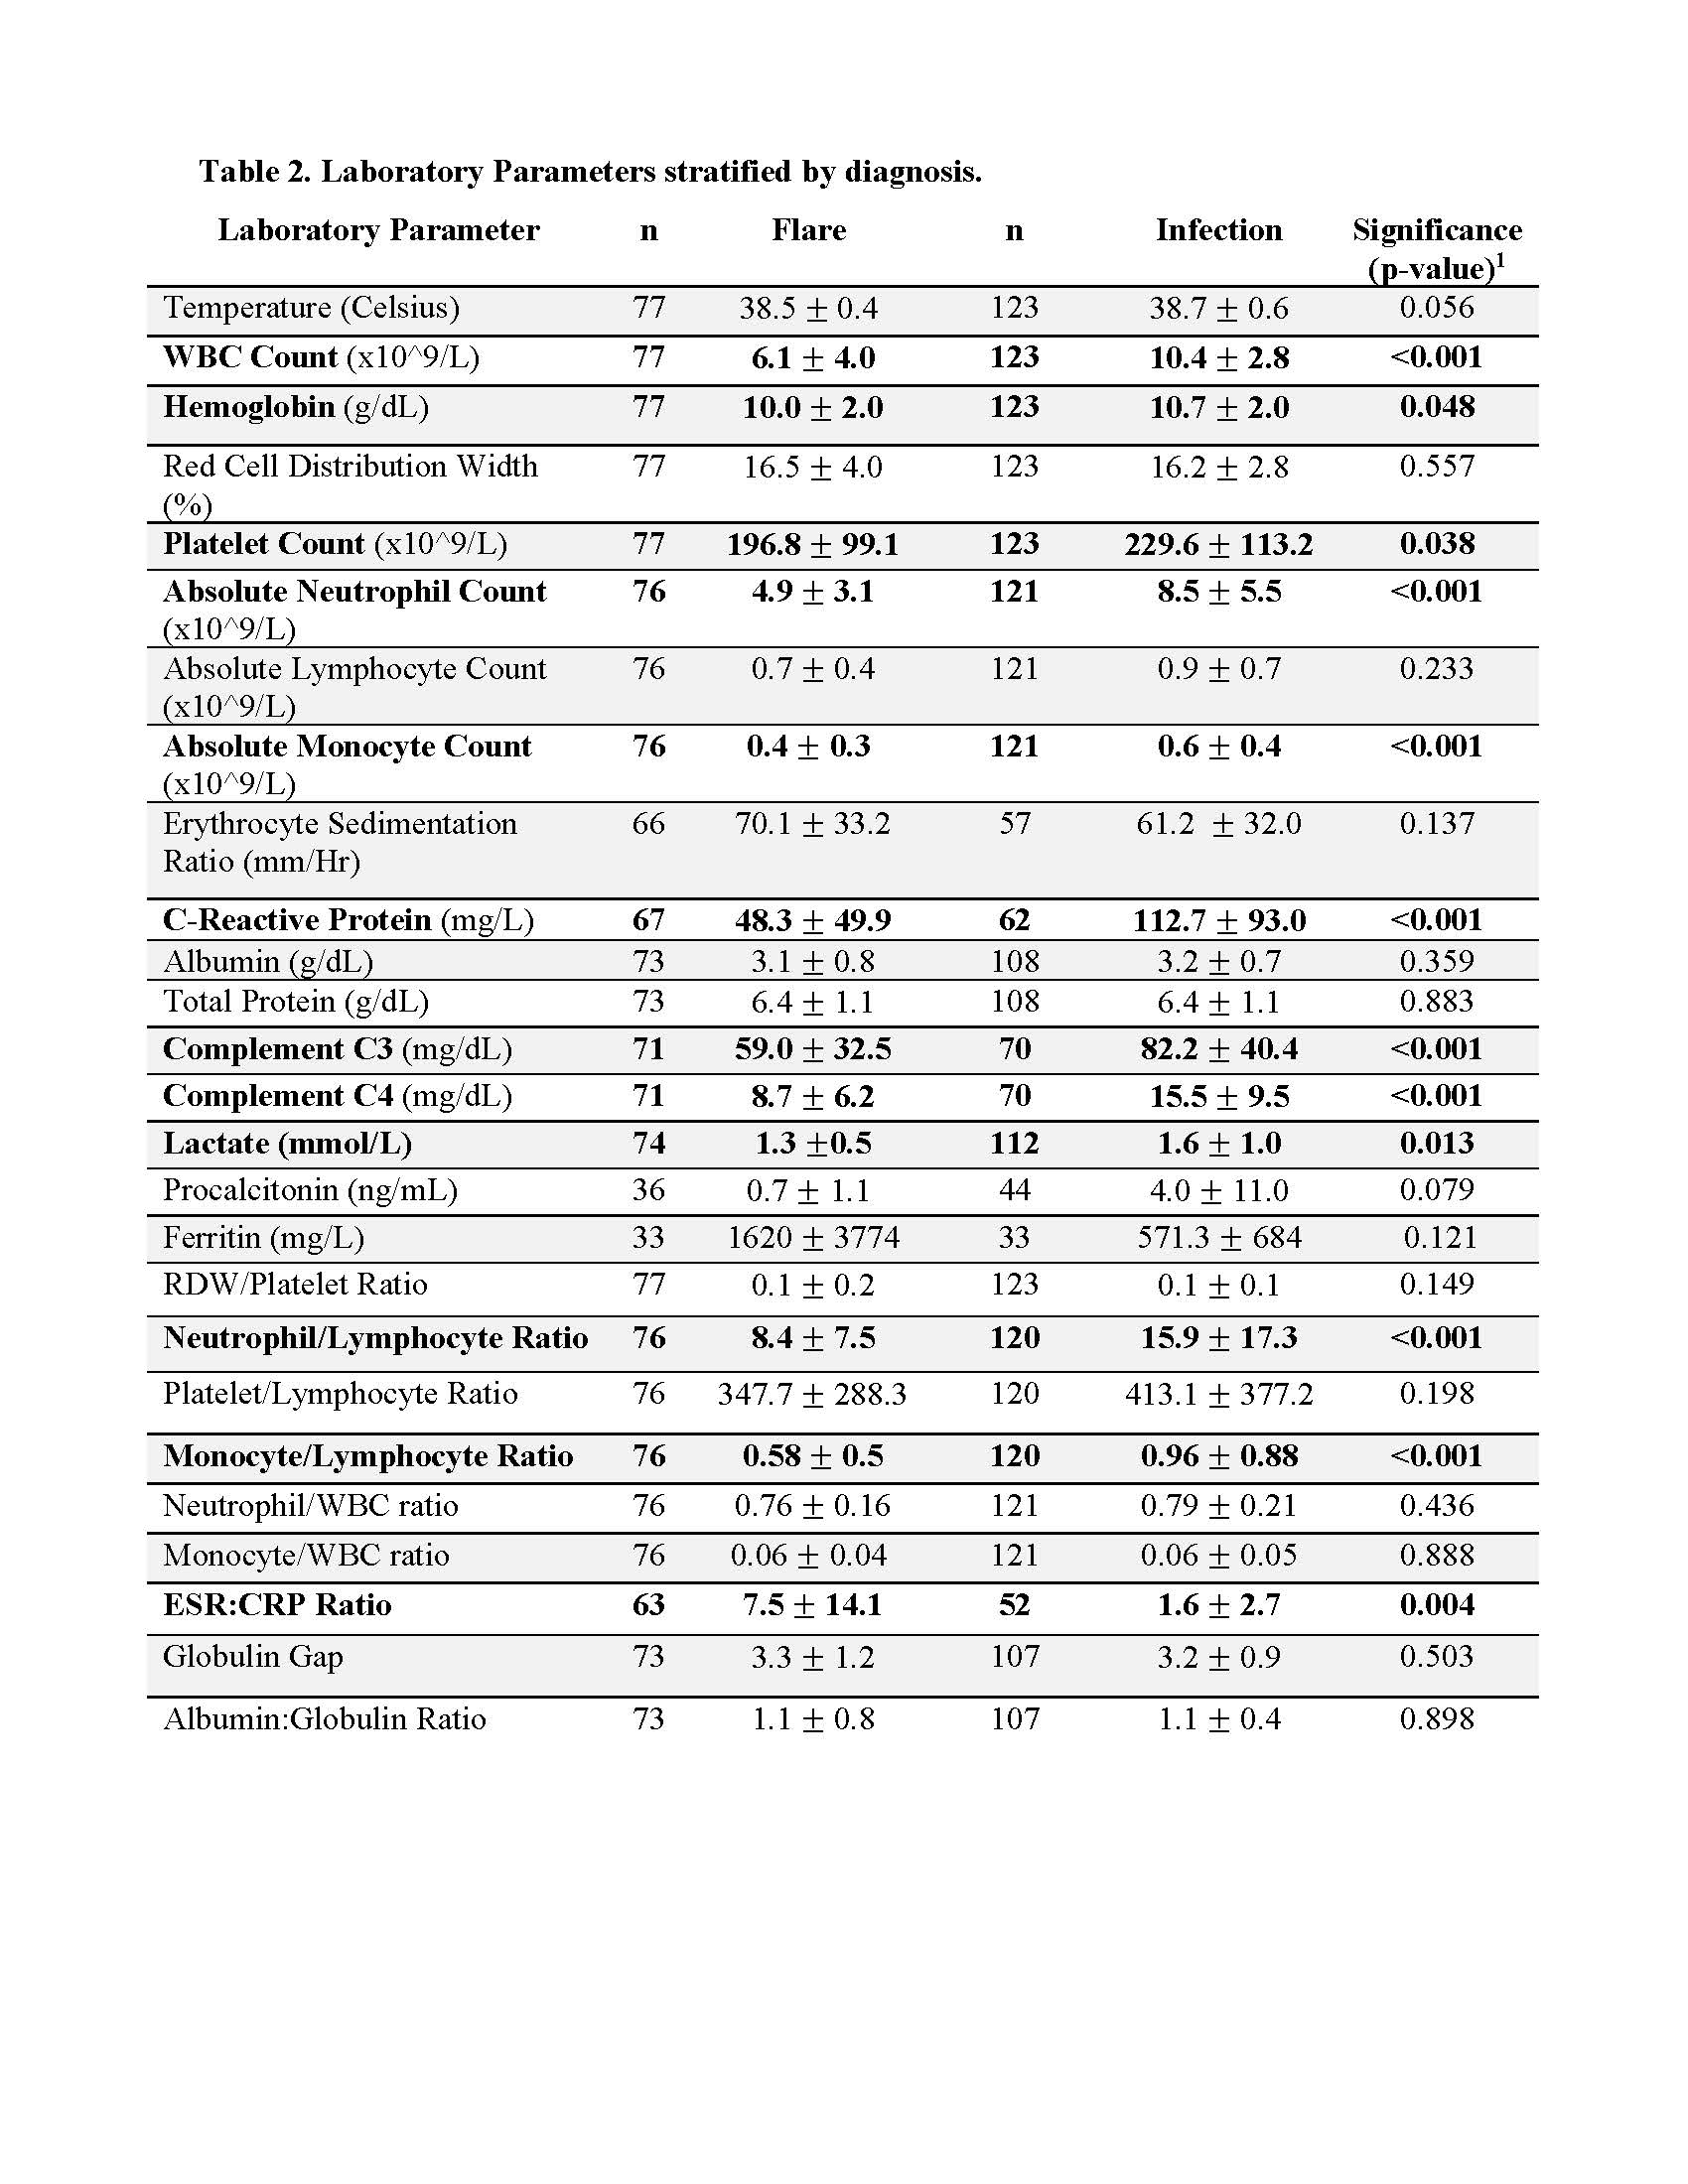
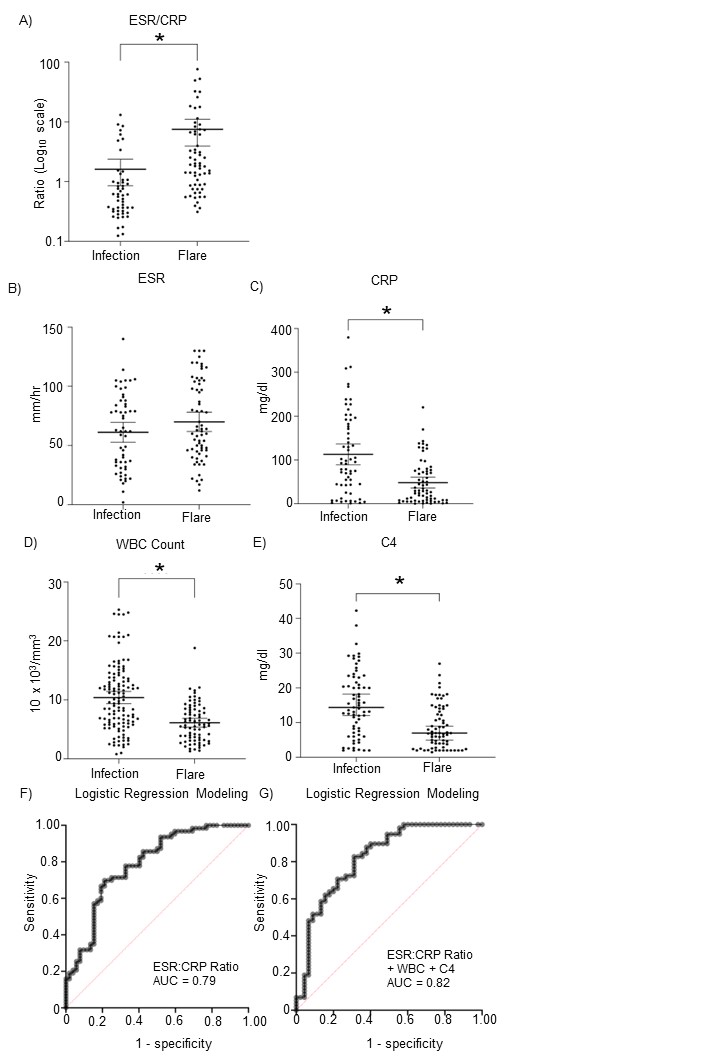
Results: The study population included 200 admissions (123 infection and 77 lupus flare cases), representing 180 unique patients (Table 1). Thirteen percent of patients identified as Black and 72% as Hispanic. Febrile SLE patients with disease flare were younger than those with infection (mean age 37 versus 43, p < 0.01). Patients with an SLE flare were more likely using immunomodulatory medications on admission (25% versus 13%, p < 0.05) and were more likely to be discharged with an increased steroid regimen (84.3% versus 16.5%, p < 0.001) (Table 1). WBC count, hemoglobin, platelet count, neutrophil count, monocyte count, CRP, C3, C4, lactate, neutrophil/lymphocyte ratio, monocyte/lymphocyte ratio, and ESR:CRP ratio were significantly different in febrile SLE patients ultimately diagnosed with an infection from those diagnosed with an SLE flare (Table 2). Multivariable mixed effects logistic regression indicated that optimized differentiation of infection from SLE flare using a single metric is best when considering the ESR:CRP ratio, yielding a receiving operator characteristic (ROC) area under the curve (AUC) of 0.79. Combining the ESR:CRP ratio, C4 level, and WBC count improved the AUC to 0.82 (Figure 1). We defined ideal predictive cut-off point values for ESR:CRP ratio, WBC count, and C4 within the model. The thresholds for predicting flare over infection for each variable are ESR:CRP ratio ≥ 3.4 (Odds Ratio [OR] 1.39, Sensitivity [SE]=0.85, Specificity [SP]=0.35), WBC count ≤ 9.4 10^3/mm3 (OR 2.33, SE=0.52, SP=0.84), and for C4 ≤ 10.9 mg/dl(OR 1.67, SE=0.69, SP=0.69).
Conclusion: The ESR:CRP ratio, readily available in clinical settings, has utility in discriminating infection from flare in febrile SLE patients and warrants prospective validation.
Figure 1. Scatterplots and ROC for variables included in ESR:CRP ratio + WBC count + C4 model. Scatter plots for ESR (A), CRP (B), and variables used in the model (C-E). *p<0.01, independent t-tests, Data are presented as individual points and mean ± 95% confidence interval. The ROC curves for the ESR:CRP ratio alone as well as the ESR:CRP ratio + WBC count + C4 used for logistics regression (F) as well as ESR:CRP ratio + WBC count + C4 vs. CRP + WBC count + C4.
Table 1. Demographics (sex, race/ethnicity, age, hospital site of admission), immunomodulatory medications and prednisone equivalents at time of admission, and proportion of patients discharged with increased steroid use and/or antimicrobials. All numbers represent the first case if the same patient had multiple presentations. All statistics Chi-square, except age which was a independent, t-test shown as mean +/- SD. UCLA = University of California, Los Angeles; LAC = Los Angeles County; USC = University of Southern California; DMARD = disease-modifying antirheumatic drugs; GC = glucocorticoids; mg = milligrams
Table 2. Laboratory parameters as stratified by diagnosis of infection or flare. All values used are results from the first 48hours of admission. Hypothesis testing was conducted using independent t-tests. Data are presented as mean ± standard deviation. WBC = white blood cells; RDW = red cell distribution width; ESR = erythrocyte sedimentation rate; CRP = c-reactive protein; globulin gap = total protein – albumin
A. Amarnani: None; F. Liu: None; M. Wilson: None; N. Lim: None; W. Stohl: GSK, 5, Pfizer, 5; L. Wise: AstraZeneca, 6, Aurinia Pharma, 2, 6, GlaxoSmithKlein(GSK), 6.


.jpg)