Poster Session B
Systemic lupus erythematosus (SLE)
Session: (0899–0933) SLE – Etiology & Pathogenesis Poster
0932: The Landscape of Immune Cells in Systematic Lupus Erythematosus Patients with Epstein-Barr Virus Infection by Single-cell Sequencing
Monday, November 13, 2023
9:00 AM - 11:00 AM PT
Location: Poster Hall
- LH
Lingzhen Hu, MMed
First Affiliated Hospital, Wenzhou medical University
Wenzhou, Zhejiang, ChinaDisclosure information not submitted.
Abstract Poster Presenter(s)
Lingzhen Hu1, Jianxin Tu1, Jiajun Gui2, Mengyuan Fang2, Xiaowei Chen1 and Li Sun1, 1The First Affliated Hospital of Wenzhou Medical University, Wenzhou, China, 2The First Clinical College, Wenzhou Medical University, Wenzhou, China
Background/Purpose: This study aimed to analyze the immune cell profiles, especially B cells and B-cell receptor (BCR) of systematic lupus erythematosus (SLE) patients with or without Epstein-Barr virus (EBV) infection, and to identify the differences between the two groups.
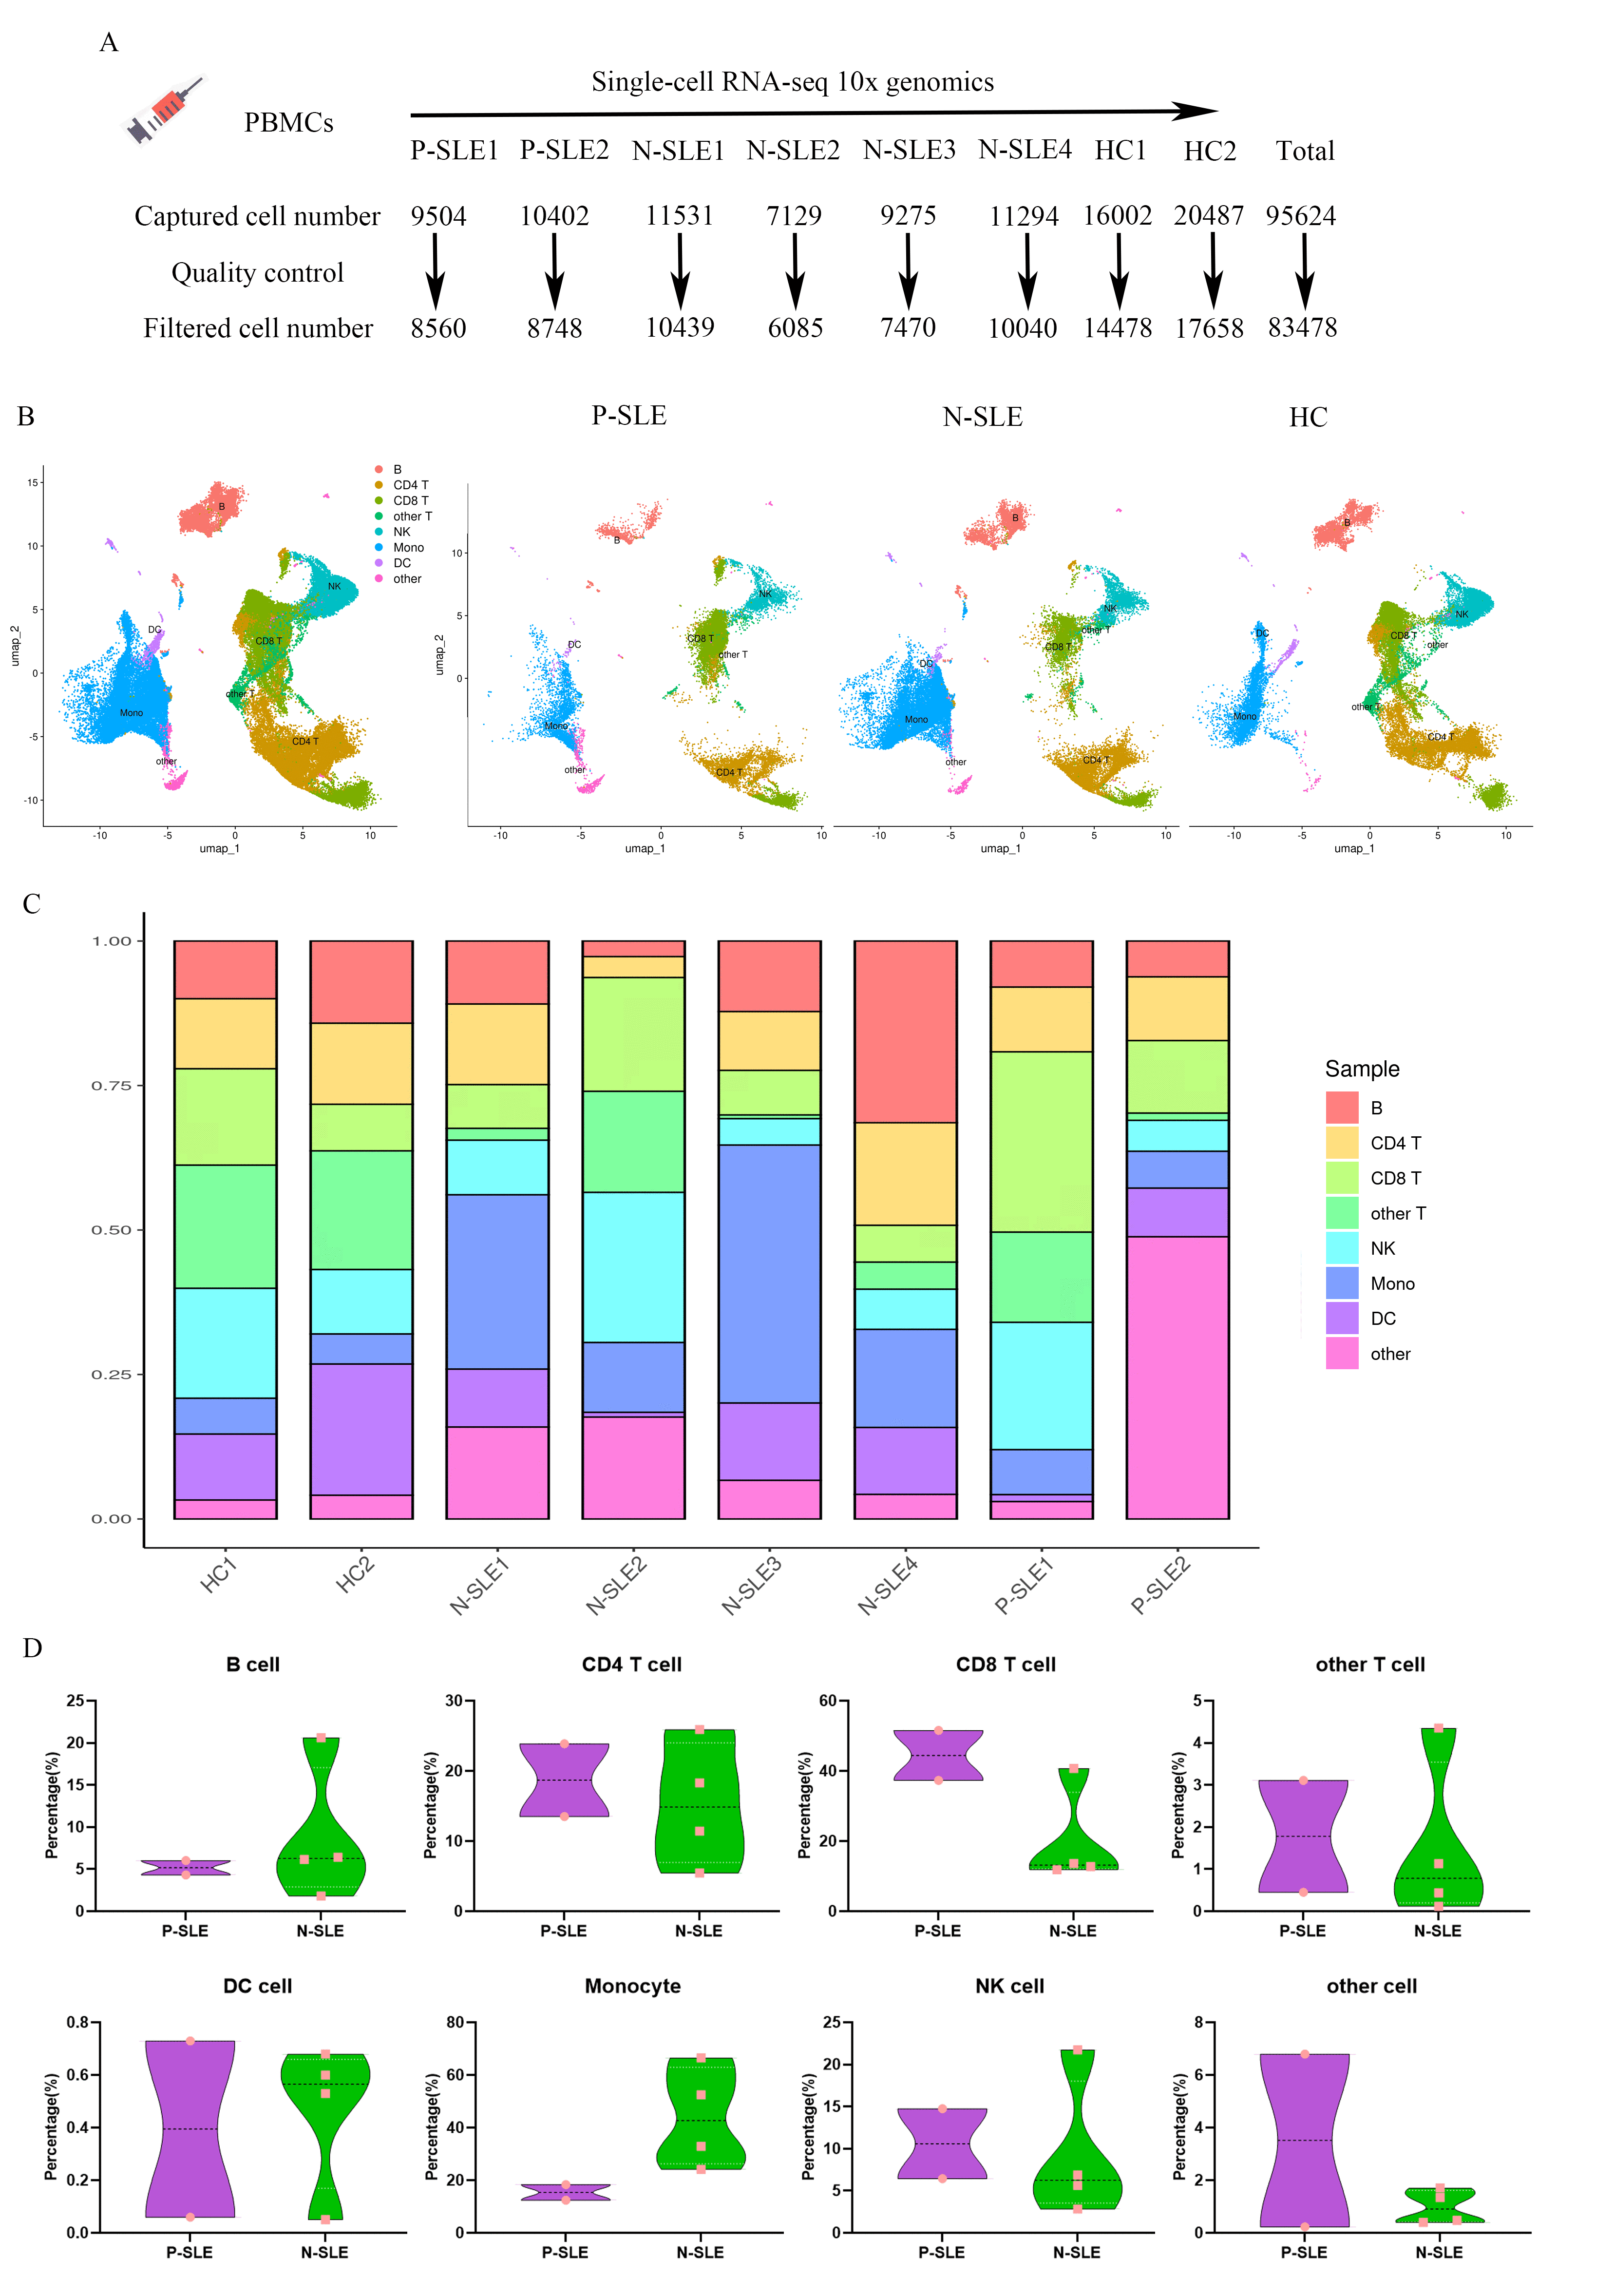
Methods: We included 2 cases of SLE patients with EBV infection (P-SLE), 4 cases of SLE patients without EBV infection (N-SLE), and 2 cases of healthy controls (HC). Using single-cell RNA sequencing (scRNA-seq) to interrogate the heterogeneity of cell populations by combining the transcriptomic profile and BCR repertoire.
Results: 83478 cells were obtained in our study and were divided into 8 major cell types or subtypes, including B cells, CD4+ T cells, CD8+ T cells, other T cells, natural killer (NK) cells, monocytes, dendritic cells (DCs) and other cells. There is no significant difference in the proportion of cell clusters between P-SLE and N-SLE. Interferon-alpha/beta pathways were upregulated in T cells, monocytes, and B cells in P-SLE compared with N-SLE. B cells were further divided into four different clusters, including naive B cells, intermediate B cells, memory B cells, and plasmablast. For V gene segments in the heavy chain, IGHV3, IGHV4, and IGHV2 gene families were frequently used in both patients and HC, especially IGHV3 and IGHV4 families. However, the frequencies of gene segments in each IGHV family were significantly different between the three groups. We also found that the BCR diversity was significantly reduced in P-SLE compared with N-SLE and HC. Moreover, IgM presents the largest proportion in all BCR repertoire, but its proportion was significantly decreased in P-SLE patients. We also observed that the proportions of IgG1, IgG3, and IgA1 were significantly increased in P-SLE than that in HC or N-SLE.
Conclusion: Our study provides a comprehensive characterization of the immune cell profiles and BCR repertoire in SLE patients with or without EBV infection, which contributes to the understanding of the mechanism for the immune response to EBV infection in SLE patients.


L. Hu: None; J. Tu: None; J. Gui: None; M. Fang: None; X. Chen: None; L. Sun: None.
Background/Purpose: This study aimed to analyze the immune cell profiles, especially B cells and B-cell receptor (BCR) of systematic lupus erythematosus (SLE) patients with or without Epstein-Barr virus (EBV) infection, and to identify the differences between the two groups.
Methods: We included 2 cases of SLE patients with EBV infection (P-SLE), 4 cases of SLE patients without EBV infection (N-SLE), and 2 cases of healthy controls (HC). Using single-cell RNA sequencing (scRNA-seq) to interrogate the heterogeneity of cell populations by combining the transcriptomic profile and BCR repertoire.
Results: 83478 cells were obtained in our study and were divided into 8 major cell types or subtypes, including B cells, CD4+ T cells, CD8+ T cells, other T cells, natural killer (NK) cells, monocytes, dendritic cells (DCs) and other cells. There is no significant difference in the proportion of cell clusters between P-SLE and N-SLE. Interferon-alpha/beta pathways were upregulated in T cells, monocytes, and B cells in P-SLE compared with N-SLE. B cells were further divided into four different clusters, including naive B cells, intermediate B cells, memory B cells, and plasmablast. For V gene segments in the heavy chain, IGHV3, IGHV4, and IGHV2 gene families were frequently used in both patients and HC, especially IGHV3 and IGHV4 families. However, the frequencies of gene segments in each IGHV family were significantly different between the three groups. We also found that the BCR diversity was significantly reduced in P-SLE compared with N-SLE and HC. Moreover, IgM presents the largest proportion in all BCR repertoire, but its proportion was significantly decreased in P-SLE patients. We also observed that the proportions of IgG1, IgG3, and IgA1 were significantly increased in P-SLE than that in HC or N-SLE.
Conclusion: Our study provides a comprehensive characterization of the immune cell profiles and BCR repertoire in SLE patients with or without EBV infection, which contributes to the understanding of the mechanism for the immune response to EBV infection in SLE patients.

Figure 1. Study design and single-cell transcriptional profiling of PBMCs from HCs and SLE patients with or without EBV. A. The schematic shows the study design. B. Cellular populations identified from 2 P-SLE, 4 N-SLE, and 2 HC, showing the formation of 8 clusters with the respective labels. Each dot corresponds to a single cell, colored according to cell type. C. A UMAP plot representing the 8 clusters across 83478 PBMCs from 8 individuals (2 P-SLE, 4 N-SLE, and 2 HC). The cluster labels were added manually. D. Violin plots comparing the proportion of each cluster between P-SLE(n=2) and N-SLE(n=4). The results for P-SLE are shown in purple, and those for N-SLE are in green, each dot corresponds to a sample. The P values were calculated using a Wilcoxon test.

Figure 2. Comparison of B cells single-cell landscapes and BCR between P-SLE, N-SLE, and HC. A. UMAP plots representing four B cell clusters with the respective labels. B. Comparison of variable (V) and joining (J) gene usage in BCR heavy chain between three groups. C. The clonal diversity of P-SLE, N-SLE, and HC. D. Analysis of Ig isotypes in three groups.
L. Hu: None; J. Tu: None; J. Gui: None; M. Fang: None; X. Chen: None; L. Sun: None.


