1428: Guselkumab Provides Clinically Meaningful Improvents in Patient-Reported Outcomes in Patients with Active Psoriatic Arthritis Who Are Inadequate Responders to Tumour Necrosis Factor Inhibitors: Results Through One Year of a Phase 3b, Randomized, Controlled Study (COSMOS)
Laure Gossec1, Xenofon Baraliakos2, James Galloway3, Lars Erik4, Vilija Oke5, Petros Sfikakis6, Emmanouil Rampakakis7, Mohamed Sharaf8, Frederic Lavie9 and Iain McInnes10, 1Sorbonne Université and Pitié Salpêtrière Hospital, Paris, France, 2Rheumazentrum Ruhrgebiet Herne, Ruhr-University Bochum, Herne, Germany, 3King's College London, London, United Kingdom, 4Bispebjerg-Frederiksberg Hospital, Vedbæk, Denmark, 5Karolinska Institutet, Stockholm, Sweden, 6National Kapodistrian University of Athens Medical School, Athens, Greece, 7JSS Medical Research, Saint-Laurent, QC, Canada, 8Immunology, Janssen MEA, Dubai, United Arab Emirates, 9The Janssen Pharmaceutical Companies of Johnson & Johnson, Paris, France, 10University of Glasgow, Glasgow, United Kingdom
Background/Purpose: In the Phase 3b COSMOS trial, guselkumab (GUS), a fully human IL-23p19 inhibitor (i), was associated with significantly greater improvements vs placebo (PBO) in joint and skin disease at week (W) 24 in patients (pts) with active PsA with inadequate response (IR) to TNFi1. Here, we report GUS effect on achievement of clinically important improvements (CII) in patient-reported outcomes (PROs) through W48 of COSMOS.
Methods: COSMOS pts had active PsA (≥3 swollen and ≥3 tender joints; SJC/TJC) after discontinuing 1-2 TNFi due to lack of efficacy or intolerance. Pts were randomised (2:1) to GUS 100 mg or PBO at W0, W4, then Q8W through W44. PBO pts crossed over to GUS at W16 (early escape if < 5% improvement in SJC/TJC) or W24. Early response to GUS was assessed with achievement of minimal CII (MCII; 15-point improvements on 0-100 VAS) in Pt Pain, pt global assessment of psoriasis (PtGA PsO), PtGA Arthritis, and PtGA PsO/Arthritis, and Dermatology Life Quality Index (DLQI) MCII (≥5-point-improvement in pts with DLQI ≥5, PsO BSA ≥3% & IGA ≥2 at BL). More rigorous response criteria were used for longer-term pt outcomes: Functional Assessment of Chronic Illness Therapy – Fatigue (FACIT-F; ≥4-point improvement), Health Assessment Questionnaire Disability Index (HAQ-DI; ≥0.35-point improvement), DLQI 0/1 (in pts with DLQI >1, PsO BSA ≥3%, and IGA ≥2 at BL), and 36-item Short-Form Health Survey physical component summary score (SF-36 PCS; ≥5-point improvement). GUS vs PBO were compared with logistic regression adjusting for BL levels, number of prior TNFi, and concomitant use of conventional synthetic DMARDs. Non-responder imputation (NRI) was used for missing data and pts meeting treatment failure criteria.
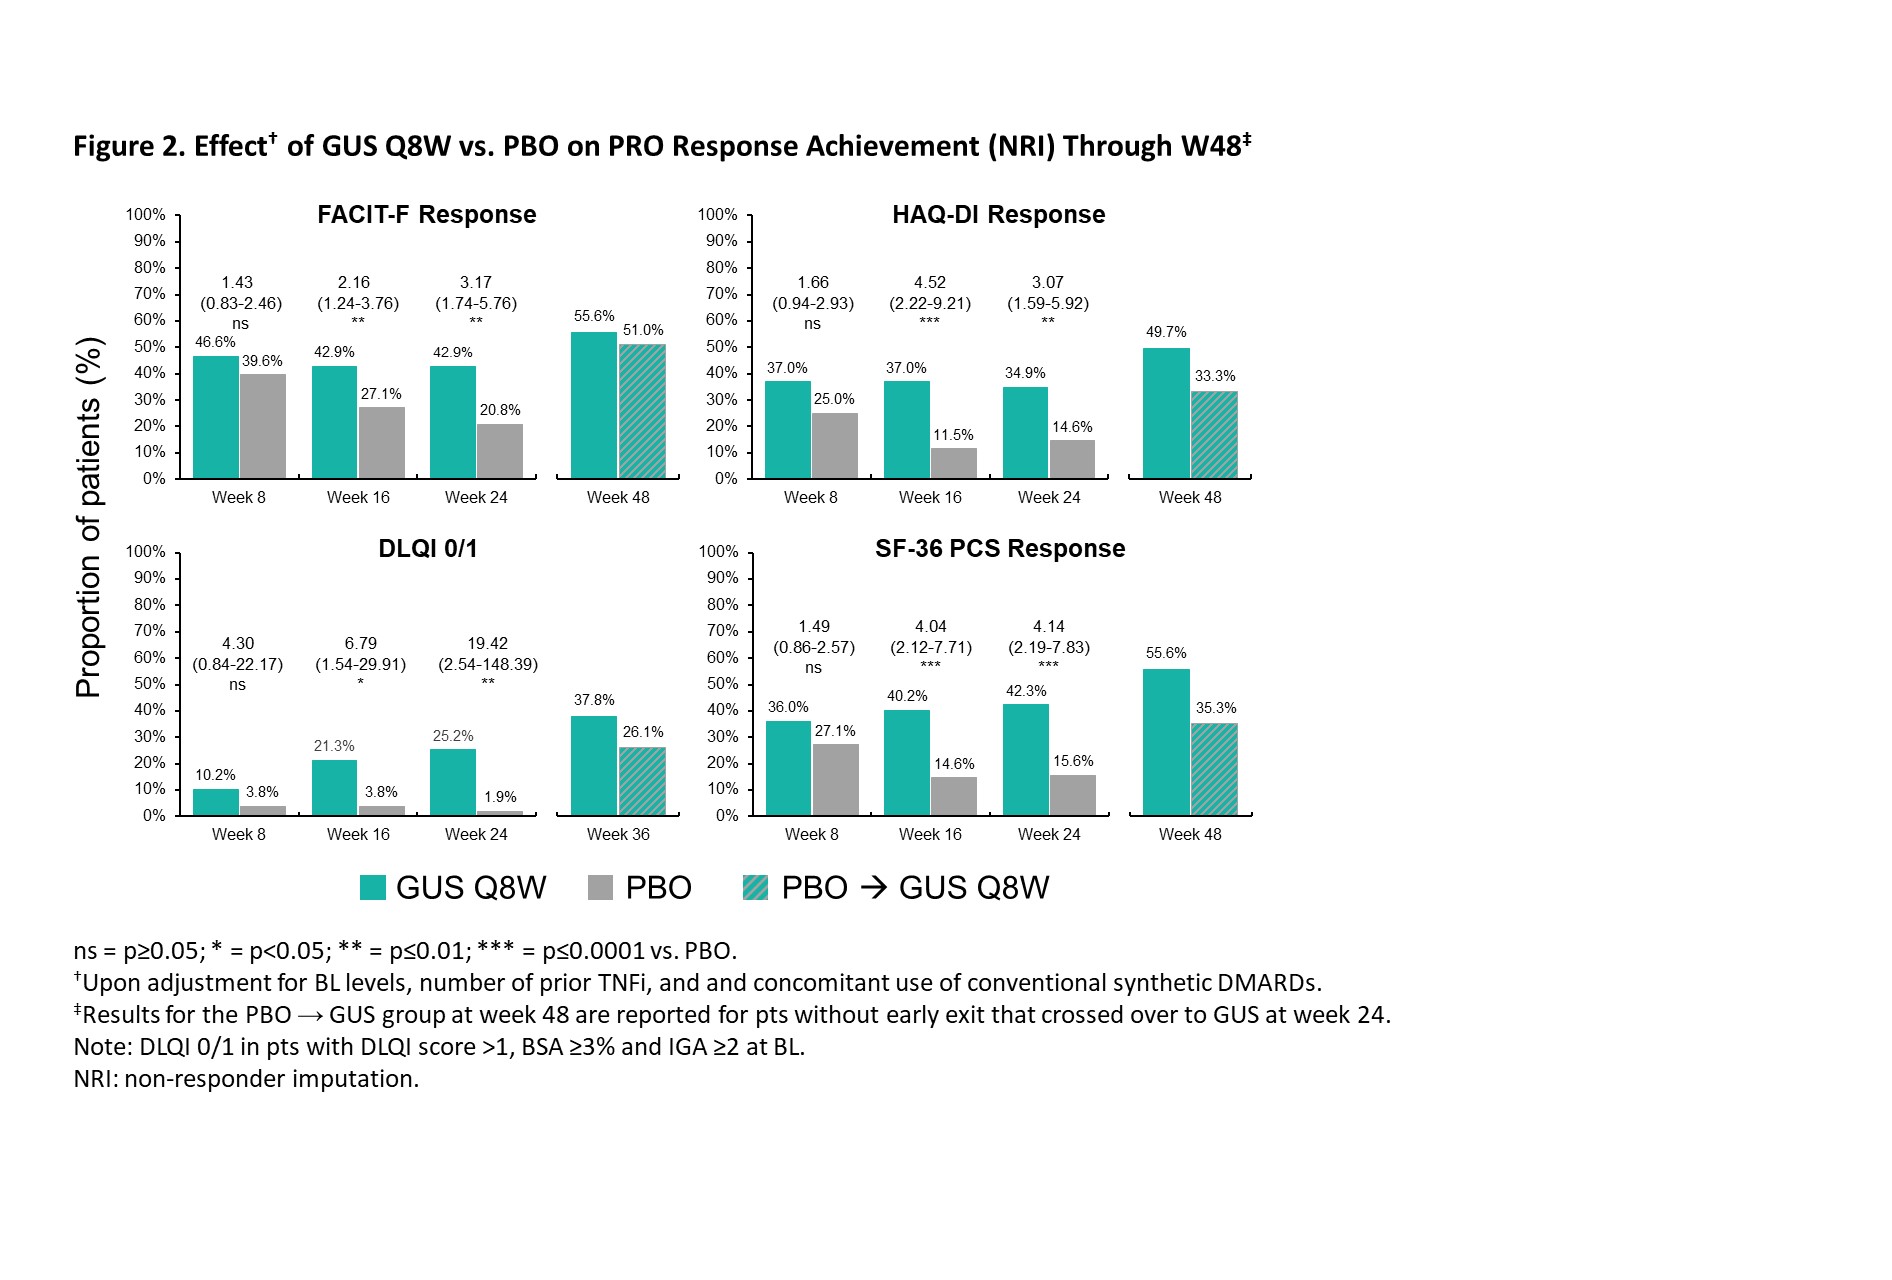
Results: The post hoc analysis included 285 randomized pts (GUS Q8W: n=189; PBO: n=96). Mean (SD) BL DLQI (13.1 [7.0]), PtGA PsO (60.9 [23.9]), PtGA Arthritis (64.2 [17.5]), PtGA PsO/Arthritis (66.6 [17.9], Pt Pain (63.2 [18.6]), FACIT-F (29.2 [11.0]), and SF-36 PCS (33.3 [7.3]) scores indicated active disease and impaired health-related quality of life (QoL). GUS treatment was associated with higher rates of PRO endpoint achievement compared with PBO at W8, W16, and W24, as evidenced by significantly greater odds of achieving MCII in PtGA PsO (odds ratio range across timepoints [ORs]: 3.0-10.2), PtGA Arthritis (ORs: 1.8-4.5), PtGA PsO/Arthritis (ORs: 3.0-5.2), Pt Pain (ORs: 2.3-4.5), and DLQI (ORs: 10.4-15.5) as of W8 (Figure 1), as well as responses in FACIT-F (ORs: 1.7-3.0), HAQ-DI (ORs: 2.2-2.8), DLQI 0/1 (ORs: 10.6-24.7), and SF-36 PCS (ORs: 1.3-2.9) through W24 (Figure 2). Further increases in response rates (NRI) were seen through W48 of GUS, with consistent patterns following crossover from PBO to GUS.
Conclusion: In PsA pts with TNFi-IR, GUS was associated with rapid effect for achievement of MCIIs and sustained achievement of more rigorous response criteria across PROs, including patient-reported skin and joint symptoms, pain, fatigue, functional status, and skin-specific and physical function-related QoL, with increasing response rates from W24 to W48.
References 1. Coates LC. Ann Rheum Dis. 2022;81:359
L. Gossec: AbbVie, 2, 12, Personal fees, Amgen, 2, Biogen, 5, BMS, 12, Personal fees, Celltrion, 12, Personal fees, Eli Lilly, 5, 12, Personal fees, Galapagos, 12, Personal fees, Janssen, 12, Personal fees, MSD, 12, Personal fees, Novartis, 5, 12, Personal fees, Pfizer, 12, Personal fees, Sandoz, 5, 12, Personal fees, UCB Pharma, 5, 12, Personal fees; X. Baraliakos: AbbVie, 2, 6, BMS, 2, 6, Chugai, 2, 6, Eli Lilly, 2, 6, Galapagos, 2, 6, Gilead, 2, 6, MSD, 2, 6, Novartis, 2, 6, Pfizer Inc, 2, 6, UCB, 2, 6; J. Galloway: AbbVie, 2, 5, 6, AstraZeneca, 5, Biogen, 6, Eli Lilly, 2, 5, 6, Galapagos, 2, 5, 6, Janssen, 2, 5, 6, Pfizer, 2, 5, 6, UCB, 2, 5, 6; L. Erik: AbbVie, 2, 5, 6, Amgen, 2, 6, Biogen, 2, 6, Bristol-Myers Squibb, 2, 6, Eli Lilly, 2, 5, 6, Gilead, 2, 6, Janssen, 2, 6, MSD, 2, 6, Novartis, 2, 5, 6, Pfizer, 2, 6, UCB, 2, 5, 6; V. Oke: AbbVie/Abbott, 2, AstraZeneca, 2, Eli Lilly, 2, Janssen, 2, Novartis, 2, UCB, 2; P. Sfikakis: AbbVie/Abbott, 2, 5, Amgen, 2, 5, Boehringer-Ingelheim, 2, 5, Celgene, 2, 5, Eli Lilly, 2, 5, Janssen, 2, 5, Novartis, 2, 5, Pfizer, 2, 5; E. Rampakakis: Janssen, 2, JSS Medical Research, 3; M. Sharaf: Janssen, 3, Johnson & Johnson, 11; F. Lavie: Janssen, 3, Johnson & Johnson, 11; I. McInnes: AbbVie, 2, Amgen, 2, AstraZeneca, 2, Bristol Myers Squibb, 2, 5, Cabaletta, 2, 11, Causeway Therapeutics, 2, 11, Celgene, 2, 5, Compugen, 2, 11, Dextera, 11, Eli Lilly, 2, EveloBio, 1, 2, 4, 11, Gilead, 2, Janssen, 2, 5, Moonlake, 2, NHS GGC, 4, Novartis, 2, 5, Pfizer, 2, Sanofi, 2, UCB, 2, 5, Versus Arthritis, 12, Trustee Status.


.jpg)