Addison Pacheco1, Michael Tang1, Sinead Maguire2, Melissa Lim1, Fataneh Tavasolian3, Zoya Qaiyum4 and Robert Inman1, 1University Health Network, Toronto, ON, Canada, 2Toronto Western Hospital, Toronto, ON, Canada, 3Krembil Research Institute, University Health Network, Toronto, ON, Canada, 4Krembil Research Institute, Toronto, ON, Canada
Background/Purpose: Axial spondyloarthritis (AxSpA) is an inflammatory disease that predominantly affects the spine and the sacroiliac joints. Dysregulation of Type 3 immunity has been implicated in AxSpA pathogenesis, as AxSpA is characterized by overactive IL-17A-producing cells, including Th17 and γδ T cells. Therapeutically, biologics such as secukinumab, that target the cytokine IL17A, have demonstrated improved clinical outcomes in a significant percentage of patients. Despite this translational success, there is a gap in understanding how type 3 immunity is regulated and normalized by secukinumab. Our study aims to measure the frequencies of type 3 pro-inflammatory and anti-inflammatory cell subsets in AxSpA patients following secukinumab treatment and to discriminate these profiles between responders and non-responders. We hypothesized that patients that respond to secukinumab are able to reduce the frequency of IL-17A producing cell subsets by normalizing the frequency of CD4+ regulatory T cells (Tregs).
Methods: 65 Patients with AxSpA treated with secukinumab were recruited to the study. Peripheral mononuclear cells (PBMCs) were collected at baseline prior to treatment, and at 16- and 24- week post-treatment. Flow cytometry analysis of several IL-17A-producing cell subsets was used to assess differences in frequency between responders (n=13) and nonresponders (n=7) during secukinumab treatment.Age and sex-matched healthy controls (n=13) were used to compare the frequencies of cell subsets in patients to a control population sample. Transcripts from FACS-sorted mature CD45RO+CD4s were measured in secukinumab responders (n=8) and nonresponders (n=7) using NanoString.
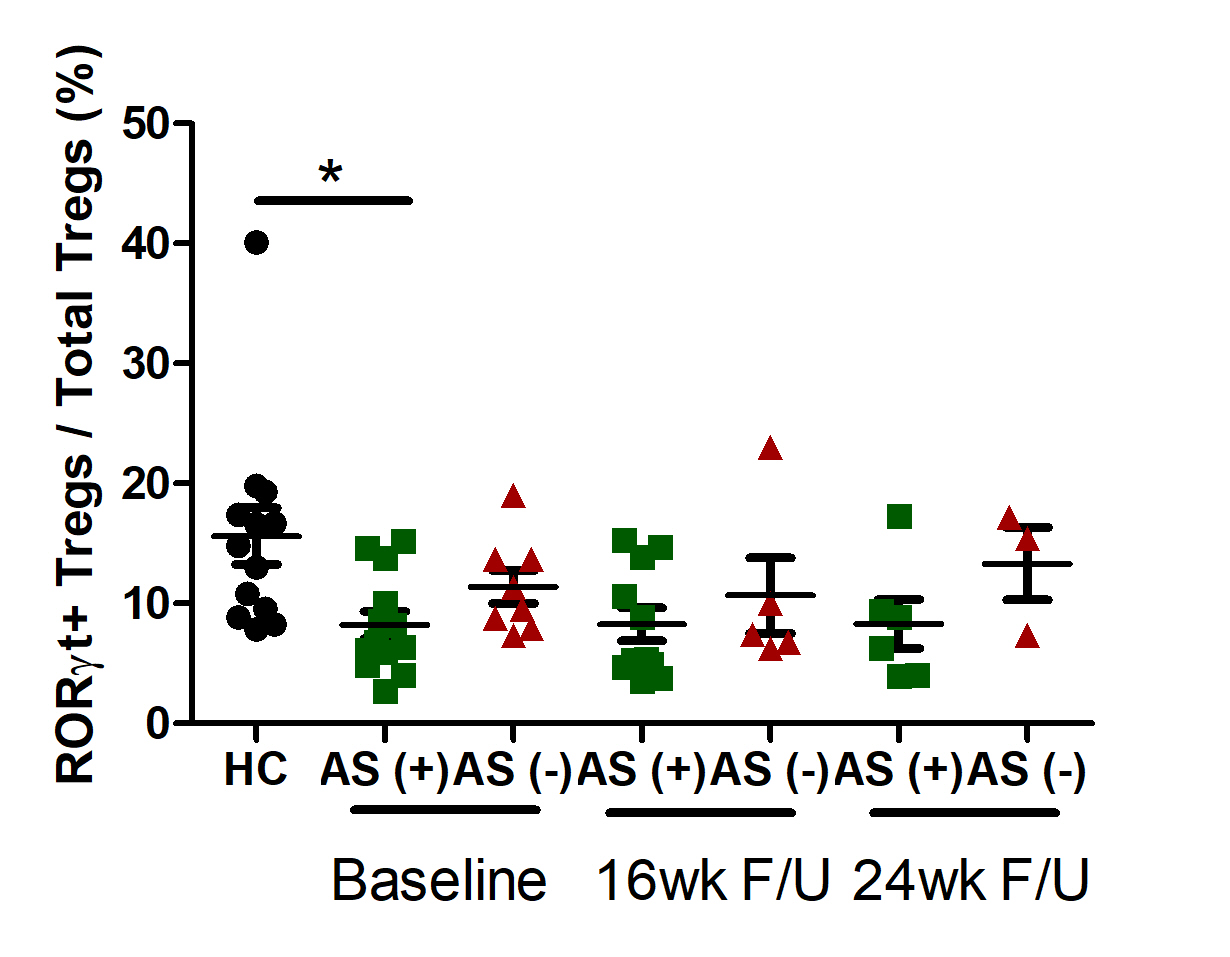
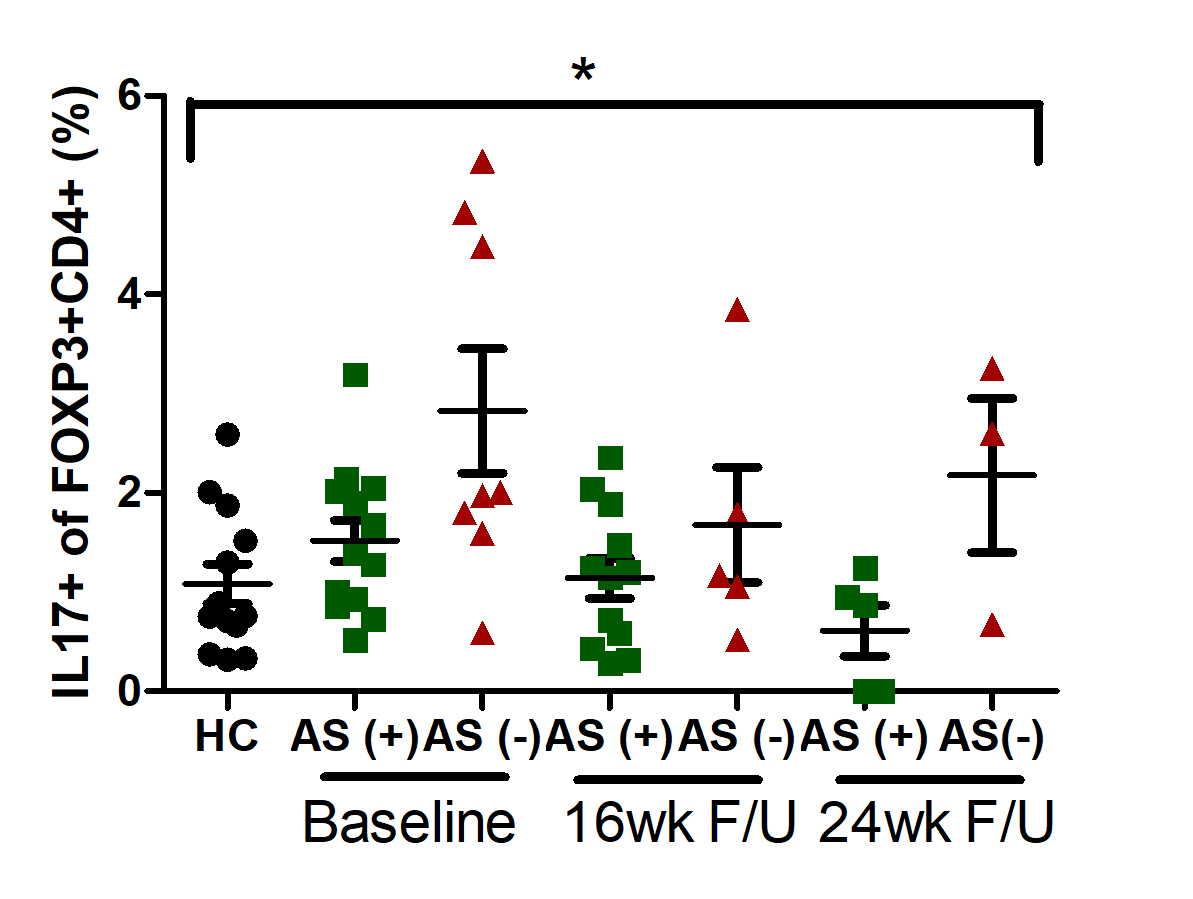
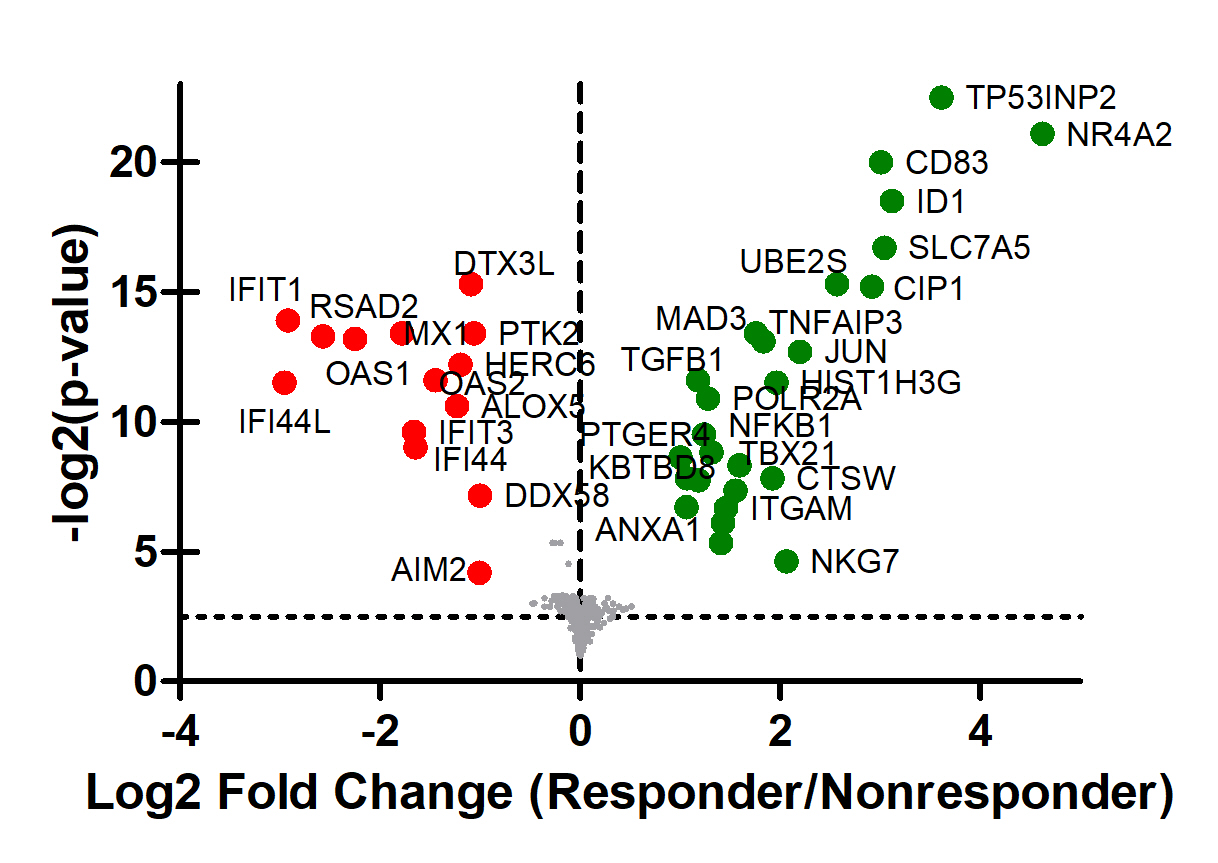
Results: Compared to baseline, we found no difference in the Treg frequencies relative to total CD4+ T cells in patients after secukinumab treatment. However, baseline frequencies of RORγt+ Tregs in PBMC of AxSpA patients that responded to secukinumab treatment were significantly reduced by 47.1% compared to healthy controls (Fig 1, p< 0.05). The frequency of RORγt+ Tregs negatively correlated with BASDAI (r(18)=-0.4751, p< 0.05). At 16 and 24 weeks after treatment, the frequencies of RORγt+ Tregs in AxSpA responders appeared unchanged compared to baseline frequency. Secukinumab treatment had a significant effect on IL17+FOXP3+CD4 frequency (Fig 2, p< 0.05) but none on IL17+RORγt+CD4s frequency (p=0.138).When compared to secukinumab nonresponders, secukinumab responders had a significant downregulation of OAS2, IFI44L and OAS1 in mature CD4s (Fig 3). Gene ontology pathway analysis indicate that these genes are involved in viral response.
Conclusion: In AxSpA, frequencies of IL-17A-producing FOXP3+CD4+ cells correspond to clinical improvement after secukinumab treatment. Frequencies of RORγt+ Tregs were significantly decreased in AxSpA patients compared with controls. This subset correlates with clinical activity and may be an informative biomarker with diagnostic potential for AxSpA. These findings underscore the importance of regulating type 3 immunity to control inflammation in AxSpA patients.
Figure 1. Analysis of RORyt+ Tregs in the Periphery of AxSpA patients. Dot plots represent frequencies of RORyt+ Tregs from PBMCs of Healthy Control (HC) and Axial Spondyloarthritis (AS) patients. Data represent 13 healthy controls, 13 secukinumab responders (green squares), and 7 nonresponders (red triangles). *p<0.05 significant by Mann-Whitney test. Frequencies analyzed using FlowJo 10.8.0 and plotted using GraphPad Prism 5.
Figure 2. Analysis of IL17+FOXP3+CD4s in the Periphery of AxSpA patients. Dot plots represent frequencies of IL17+ FOXP3+CD4s relative to FOXP3+CD4s in PBMCs of Healthy Control (HC) and Axial Spondyloarthritis (AS) patients. PBMCs were stimulated with PMA and ionomycin for 5 hours. Data represent 13 healthy controls, 13 secukinumab responders (green squares), and 7 nonresponders (red triangles). *p<0.05 significant by Kruskal-Wallis test. Frequencies analyzed using FlowJo 10.8.0 and plotted using GraphPad Prism 5.
Figure 3. Nanostring Analysis Comparing Transcripts of CD45RO+ CD4s from Secukinumab Responders and Nonresponders. Volcano plot represents differentially regulated genes unique to secukinumab responders/non-responders quantified by NanoString analysis. Green (higher in responder) and red (higher in non-responder) dots represent genes with a log2 fold change above 1.5 and a –log2(p-value) of 4. Figure created using GraphPad Prism 5.
A. Pacheco: None; M. Tang: None; S. Maguire: None; M. Lim: Aria Pharmaceuticals, 5; F. Tavasolian: None; Z. Qaiyum: None; R. Inman: AbbVie, 2, Eli Lilly, 2, Janssen, 2, Novartis, 2, Sandoz, 2.