Andrew Porter1, Robert Maughan1, Charis Pericleous1, Lida Kabir1, Richard Stratton2, Dorian Haskard1, Pui Lee3, Taryn Youngstein1 and Justin Mason1, 1National Heart & Lung Institute, Imperial College London, London, United Kingdom, 2University College London, London, United Kingdom, 3Division of Immunology, Boston Children's Hospital, Boston, MA
Background/Purpose: Deficiency of adenosine deaminase 2 (DADA2) is an autosomal recessive condition caused by biallelic variants in the Adenosine deaminase 2 (ADA2) gene. Clinical manifestations are broad, but a vasculitis phenotype is widely recognised. Although ADA2 expression is conventionally associated with myeloid cells, a recent report identified expression in endothelial cells (ECs) and demonstrated Interferon (IFN) β induction in the absence of ADA2. The current study aimed to investigate the expression and role of ADA2 in the endothelium.
Methods: ADA2 transcript expression was explored across different tissues and cell types using Blueprint, GTEX and in-house short and long read RNA-seq datasets. Findings were validated by qRT-PCR, immunoblot and an ADA2 activity assay in primary human umbilical vein and aortic ECs (HUVEC, HAEC) and the pro-monocytic cell line U937.
Endothelial colony forming cells (ECFC) were cultured from peripheral blood mononuclear cells (PBMCs) isolated from patients with DADA2 and healthy donors, following our established protocols.
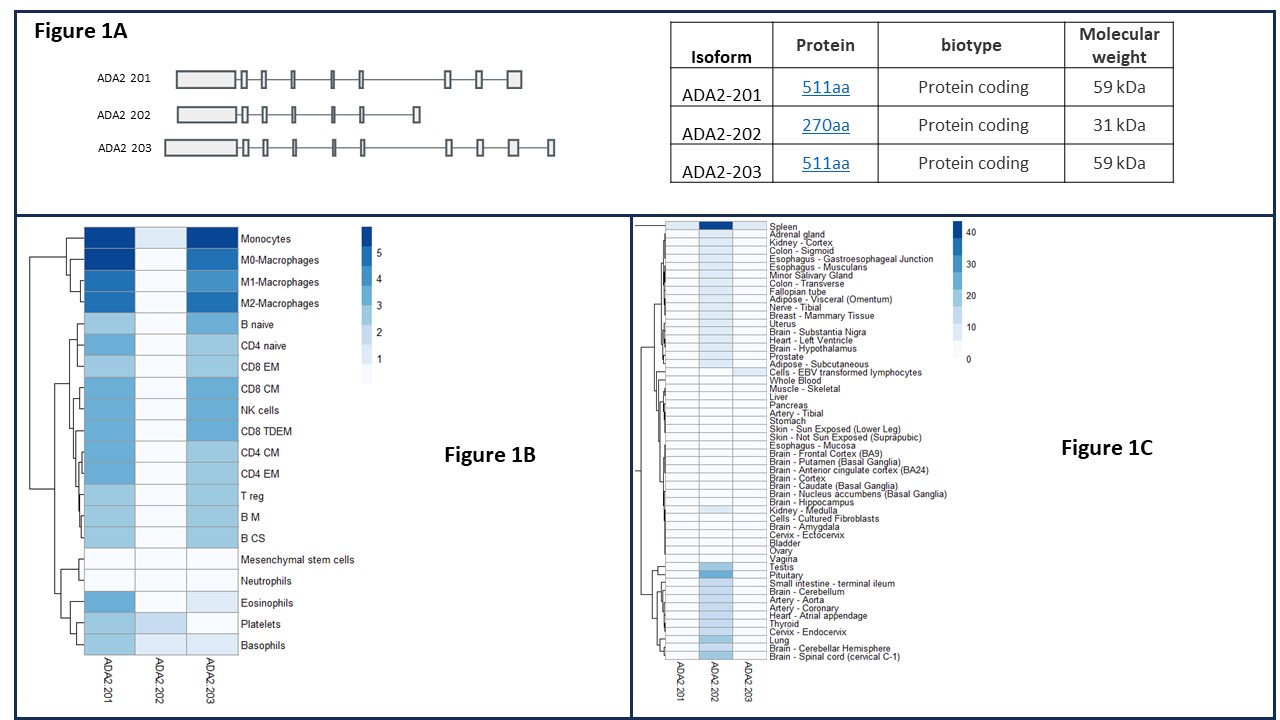
Results: We identified 3 human ADA2 isoforms: ADA2 201 and 203, the classically described myeloid derived isoforms (511 amino acids, aa) and ADA2 202 which was predicted to encode a shorter protein lacking a signal peptide and part of the deaminase domain (270 aa) (Fig 1A). In contrast to 201 and 203, the 202 isoform appears widely expressed across tissue types but absent from immune cells (Fig 1B & C).
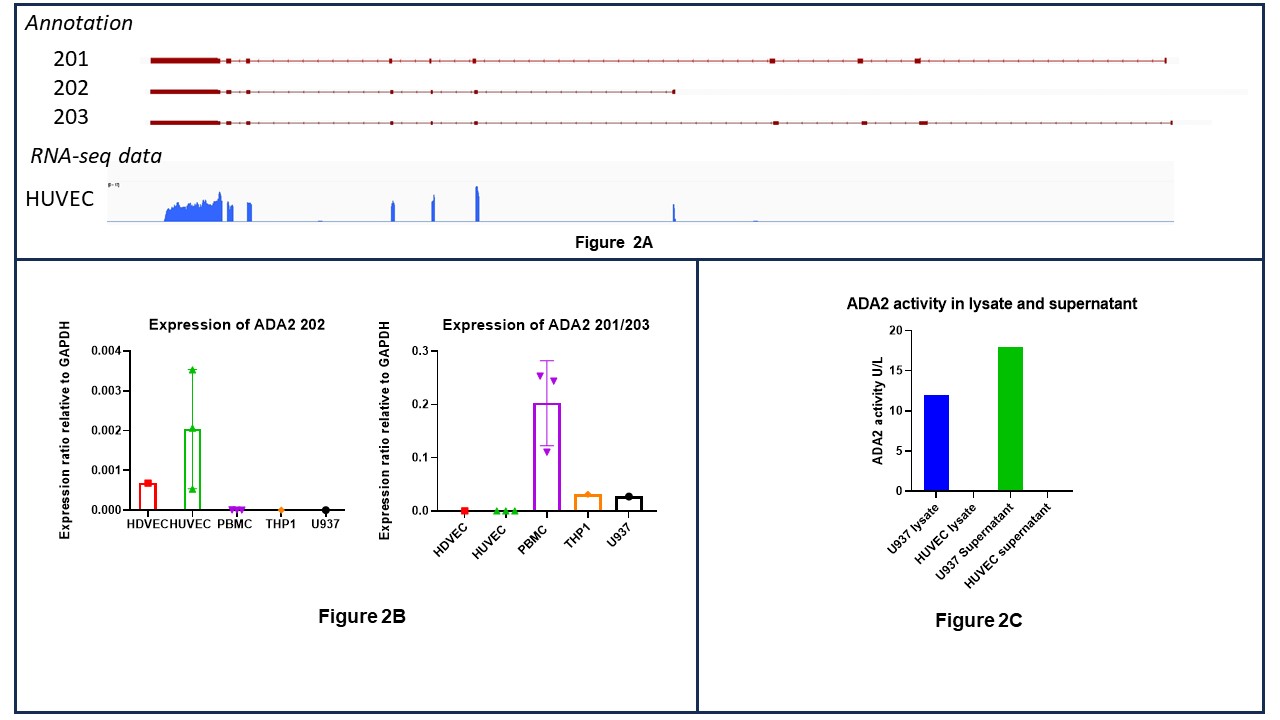
Analysis of RNA-seq data identified 202 as the sole ADA2 transcript expressed in ECs (Fig 2A). This was confirmed by qPCR using transcript-specific primers: 202 was the predominant isoform in ECs and 201/203 in PBMCs and U937 (Fig 2B).
Despite the presence of ADA2 202 mRNA, no protein or deaminase activity were detected in HUVEC or HAEC lysates or supernatants (Fig 2C). Overexpression of 201 isoform demonstrated deaminase activity and protein secretion as expected; in contrast 202 was enzymatically inactive, not secreted and retained in the insoluble protein fraction.
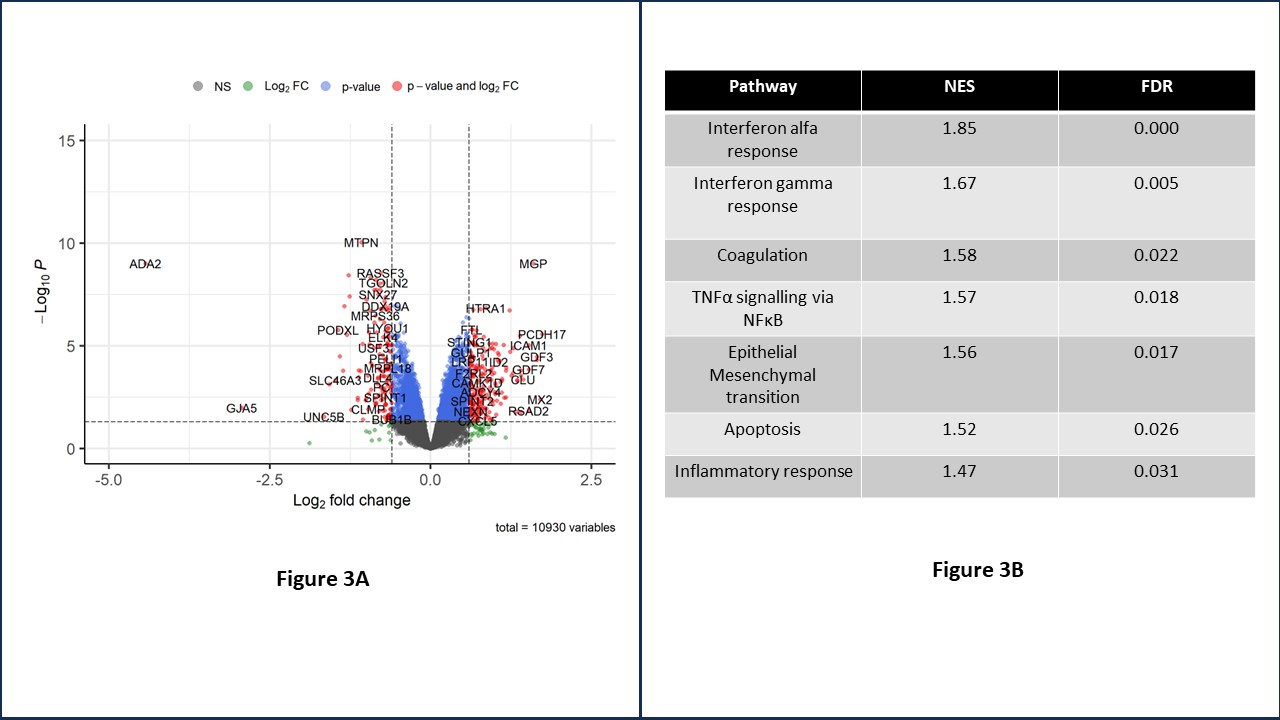
Since 202 was expressed at the mRNA but not protein level, we explored a possible regulatory function by siRNA knockdown (KD) in HUVEC (90% KD achieved). ADA2 KD resulted in dysregulation of 352 genes and enriched inflammatory (IFN, TNF), coagulant and apoptotic signalling suggesting an important role for 202 in endothelial homeostasis (Fig 3B).
Consistent with this, initial ECFC analysis demonstrated a lower proliferative and more inflammatory phenotype in DADA2 compared to healthy donor ECFC, characterised by increased ICAM-1, VCAM-1 and IFN-related gene expression (n=4 per group).
Conclusion: Endothelial ADA2 is expressed exclusively as the shortened 202 transcript but its protein form is undetectable. Artificially overexpressed 202 accumulated in the insoluble protein fraction, lacked deaminase activity and thus appeared non-functional. ADA2 knockdown in ECs led to upregulation of inflammatory apoptotic gene expression, potentially indicating a role for 202 in endothelial homeostasis as a non-coding RNA. Given its widespread tissue expression, genetic variants affecting 202 could have implications for understanding the heterogenous manifestations of DADA2.
Figure 2A – signal plot from our own RNAseq in Human Umbilical Vein Endothelial Cells (HUVEC) showing ADA2 202 transcript expression. Figure 2B - RT-qPCR demonstrating expression of ADA2 202 and ADA2 201/203 in different cell types. Human Dermal Vascular Endothelial Cells (HDVEC), Human Umbilical Vein Endothelial Cells (HUVEC), Peripheral Blood Mononuclear cells (PBMC), THP1 – monocyte cell line, U937 – pro-monocytic cell line. Figure 2C – ADA2 enzymatic activity in lysate and supernatant from U937 and HUVEC
Figure 3A – Volcano plot demonstrating differentially expressed genes with ADA2 KD in HUVEC. Figure 3B – Table demonstrating gene set enrichment pathway analysis. NES – normalised enrichment score. FDR – false discovery rate.
A. Porter: None; R. Maughan: None; C. Pericleous: None; L. Kabir: None; R. Stratton: Aurinia Pharmaceuticals Inc., 5, Riptide Bioscience Inc., 5; D. Haskard: None; P. Lee: None; T. Youngstein: None; J. Mason: None.