Poster Session A
Diversity, inclusion and racial disparities
Session: (0176–0195) Healthcare Disparities in Rheumatology Poster I: Lupus
0189: Influence of Social Support on Systemic Lupus Erythematosus (SLE) Outcomes in a Health Disparity Population
Sunday, November 12, 2023
9:00 AM - 11:00 AM PT
Location: Poster Hall

Sarah Smith, MD (she/her/hers)
Medical University of South Carolina
Charleston, SC, United StatesDisclosure information not submitted.
Abstract Poster Presenter(s)
Sarah Smith, Chloe Mattila, Lori Ann Ueberroth, L. Quinnette King, Diane L. Kamen, Paula Ramos and bethany wolf, Medical University of South Carolina, Charleston, SC
Background/Purpose: SLE disproportionately impacts African American women. Social support may have a positive impact in SLE and as such could potentially reduce disease burden. However, the relationship between social support and SLE disease outcomes has not been investigated in African American female patients with SLE. The goal of this study is to evaluate the relationship between social support and disease outcomes using data from validated participant questionnaires.
Methods: In this study of African American women, we examined differences in social support between healthy controls and patients with SLE and associations with disease severity among the patients. Social support was measured using the validated Medical Outcomes Study-Social Support (MOS-SS) survey. The physician assessed SLE Disease Activity Index (SLEDAI) and the patient reported Brief Index of Lupus Damage (BILD) were used to assess SLE severity. Associations between SLE status and overall MOS-SS score as well as the MOS-SS support domains were analyzed using a series of Wilcoxon rank-sum tests. Hodges-Lehmann estimation was used to calculate the confidence intervals for the difference in medians. Among participants with SLE, associations between MOS-SS score with disease activity (SLEDAI) and with patient reported organ damage (BILD) were evaluated using Spearman's rank correlation. All analyses were performed on RStudio v4.0.3.
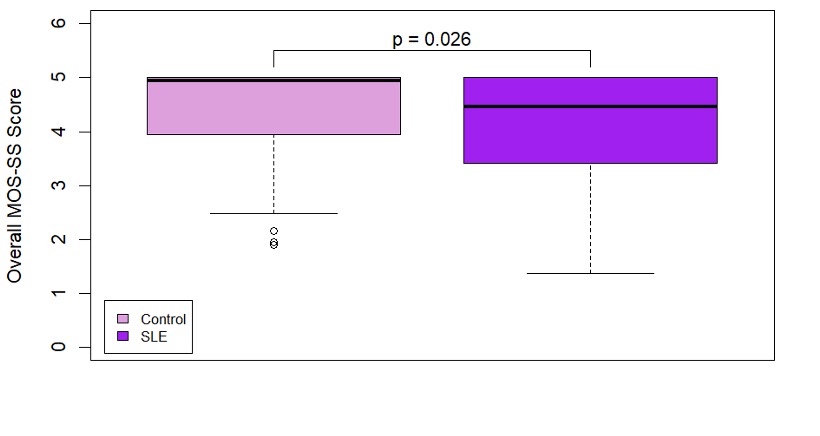
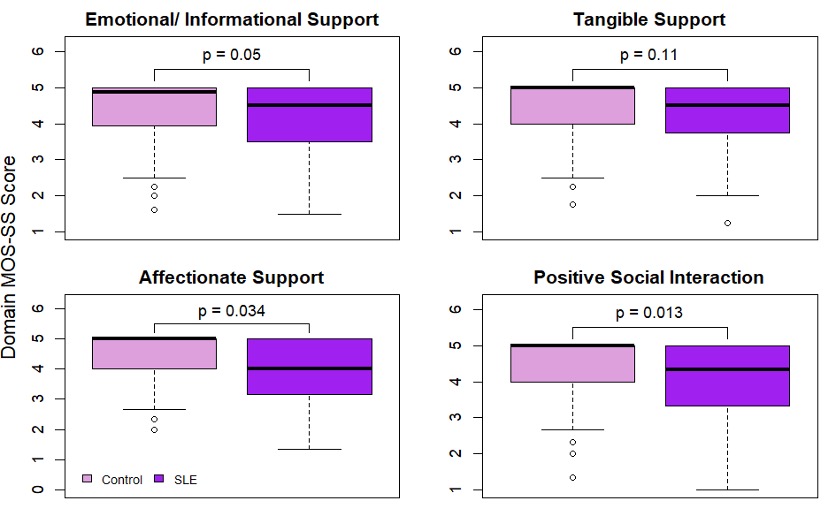
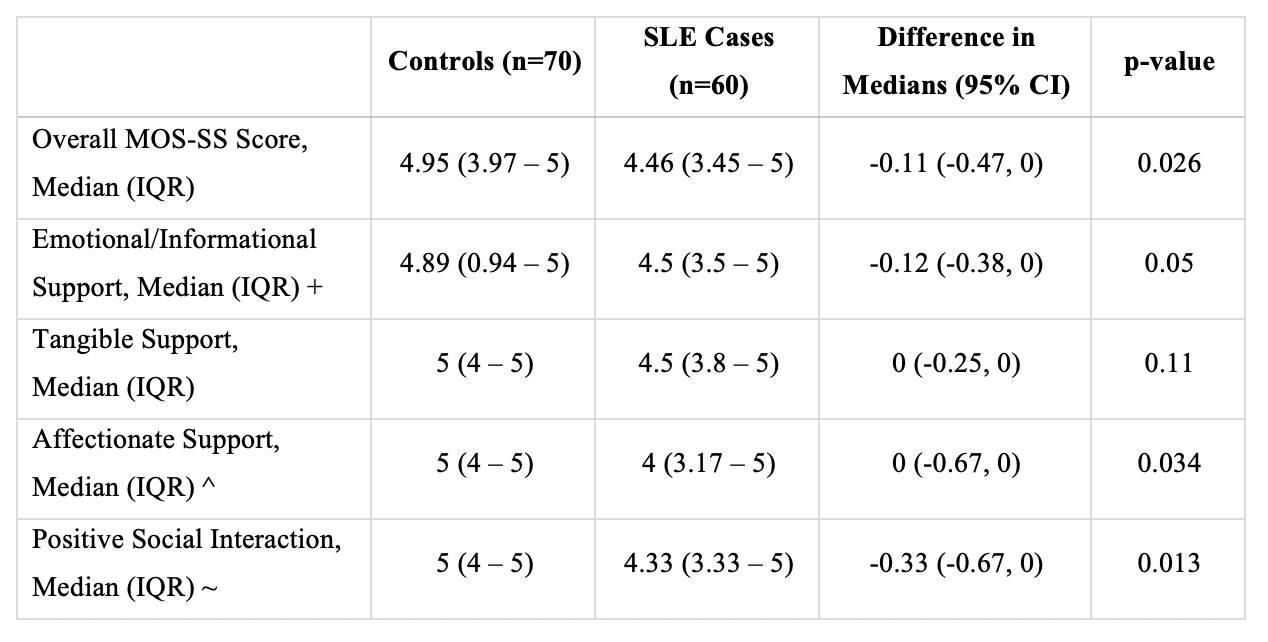
Results: This study was comprised of 70 SLE patients and 60 healthy controls, all self-identified African American females. SLE patients had significantly lower overall MOS-SS scores compared to healthy controls (p = 0.026); the distribution of overall MOS-SS scores by disease status is seen in Figure 1.When considering the MOS-SS support domains, SLE patients had significantly lower scores for the emotional/informational support, affectionate support, and positive social interaction domains (p ≤ 0.05 for all three groups). No notable difference between SLE patients and healthy controls was found for the tangible support domain. Figure 2 shows the distribution of MOS-SS score by disease status for each support domain of the MOS-SS. Table 1 shows the median (IQR) and difference in medians for the overall MOS-SS and each support domain of MOS-SS. Among SLE patients, a significant association was found between overall MOS-SS score and physician reported disease activity (using SLEDAI), such that SLE patients with higher SLEDAI scores have lower MOS-SS scores (ρ = -0.36, p = 0.0003). No significant association was found between patient reported organ damage (BILD score) and overall MOS-SS score (p = 0.48).
Conclusion: This study found significant differences in the overall MOS-SS score between SLE patients and healthy controls and furthermore, the groups differed for the emotional/ informational support, affectionate support, and positive social interaction domains. Among the SLE participants, a significant inverse correlation between SLEDAI total score and overall MOS-SS score was also observed. The potential clinical relevance of these findings suggests that targeted interventions to improve social support could potentially improve SLE outcomes, though further research is needed.


S. Smith: None; C. Mattila: None; L. Ueberroth: None; L. King: None; D. Kamen: None; P. Ramos: None; b. wolf: None.
Background/Purpose: SLE disproportionately impacts African American women. Social support may have a positive impact in SLE and as such could potentially reduce disease burden. However, the relationship between social support and SLE disease outcomes has not been investigated in African American female patients with SLE. The goal of this study is to evaluate the relationship between social support and disease outcomes using data from validated participant questionnaires.
Methods: In this study of African American women, we examined differences in social support between healthy controls and patients with SLE and associations with disease severity among the patients. Social support was measured using the validated Medical Outcomes Study-Social Support (MOS-SS) survey. The physician assessed SLE Disease Activity Index (SLEDAI) and the patient reported Brief Index of Lupus Damage (BILD) were used to assess SLE severity. Associations between SLE status and overall MOS-SS score as well as the MOS-SS support domains were analyzed using a series of Wilcoxon rank-sum tests. Hodges-Lehmann estimation was used to calculate the confidence intervals for the difference in medians. Among participants with SLE, associations between MOS-SS score with disease activity (SLEDAI) and with patient reported organ damage (BILD) were evaluated using Spearman's rank correlation. All analyses were performed on RStudio v4.0.3.
Results: This study was comprised of 70 SLE patients and 60 healthy controls, all self-identified African American females. SLE patients had significantly lower overall MOS-SS scores compared to healthy controls (p = 0.026); the distribution of overall MOS-SS scores by disease status is seen in Figure 1.When considering the MOS-SS support domains, SLE patients had significantly lower scores for the emotional/informational support, affectionate support, and positive social interaction domains (p ≤ 0.05 for all three groups). No notable difference between SLE patients and healthy controls was found for the tangible support domain. Figure 2 shows the distribution of MOS-SS score by disease status for each support domain of the MOS-SS. Table 1 shows the median (IQR) and difference in medians for the overall MOS-SS and each support domain of MOS-SS. Among SLE patients, a significant association was found between overall MOS-SS score and physician reported disease activity (using SLEDAI), such that SLE patients with higher SLEDAI scores have lower MOS-SS scores (ρ = -0.36, p = 0.0003). No significant association was found between patient reported organ damage (BILD score) and overall MOS-SS score (p = 0.48).
Conclusion: This study found significant differences in the overall MOS-SS score between SLE patients and healthy controls and furthermore, the groups differed for the emotional/ informational support, affectionate support, and positive social interaction domains. Among the SLE participants, a significant inverse correlation between SLEDAI total score and overall MOS-SS score was also observed. The potential clinical relevance of these findings suggests that targeted interventions to improve social support could potentially improve SLE outcomes, though further research is needed.

Figure 1: Distribution of overall MOS-SS score by disease status. Boxes in the plots show the median, 25th, and 75th percentiles for the overall MOS-SS scores by disease status. Whiskers extend to 1.5 times the interquartile range (IQR), with measurements outside 1.5 times the IQR being represented by open circles.

Figure 2: Distribution of MOS-SS score by disease status for each support domain of the MOS-SS. Boxes in the plots show the median, 25th, and 75th percentiles for the overall MOS-SS scores by disease status. Whiskers extend to 1.5 times the interquartile range (IQR), with measurements outside 1.5 times the IQR being represented by open circles.Figure 2: Distribution of MOS-SS score by disease status for each support domain of the MOS-SS. Boxes in the plots show the median, 25th, and 75th percentiles for the overall MOS-SS scores by disease status. Whiskers extend to 1.5 times the interquartile range (IQR), with measurements outside 1.5 times the IQR being represented by open circles.

Table 1: Descriptive statistics for overall MOS-SS score and each support domain for the MOS-SS by disease status. Median (IQR) and difference in medians reported.
+ Only 69 SLE cases had complete MOS-SS questions applicable for the emotional/ informational domain.
^ Only 68 SLE cases and 59 controls had complete MOS-SS questions applicable for the affectionate support domain.
~ Only 59 controls had complete MOS-SS questions applicable for the positive social interaction domain.
S. Smith: None; C. Mattila: None; L. Ueberroth: None; L. King: None; D. Kamen: None; P. Ramos: None; b. wolf: None.


