Inje University Seoul Paik Hospital Seoul, South Korea
Disclosure information not submitted.
Bon San Koo1, Seo Young Park2, Ji Hui Shin3, Seunghun lee3, kyung bin Joo3 and Tae-Hwan Kim4, 1Inje University Seoul Paik Hospital, Seoul, South Korea, 2Korea National Open University, Seoul, South Korea, 3Hanyang University Hospital for Rheumatic Diseases, Seoul, South Korea, 4Department of Rheumatology, Hanyang University Hospital for Rheumatic Diseases, Seoul, South Korea
Background/Purpose: Among patients with ankylosing spondylitis (AS) treated with tumor necrosis factor (TNF) inhibitors, tapering the dose of TNF inhibitors may be considered for patients with low disease activity. While several studies have examined the relationship between tapering of TNF inhibitors and disease activity, few have investigated the relationship between tapering TNF inhibitors and radiographic progression. This study aimed to analyze the correlation between the total dose of TNF inhibitors and radiographic progression over a defined period of time, using a defined daily dose (DDD).
Methods: This retrospective study evaluated the electronic medical records of patients with AS between January 2001 and December 2018. The study included AS cohort patients from a single center who had modified Stoker Ankylosing Spondylitis Spinal Score (mSASSS) records for more than 2 years after starting TNF inhibitors. The patients were divided into follow-up periods of 2 years, 4 years, and 8 years, and the %DDD of TNF inhibitors during each period was calculated. The correlation between the percentage of DDD and changes in mSASSS was analyzed using a linear mixed model at 2-year, 3-year, and 8-year intervals. Subgroup analysis was also performed by dividing the baseline mSASSS into three groups (mSASSS ≤24, mSASSS >24 and ≤48, mSASSS > 48).
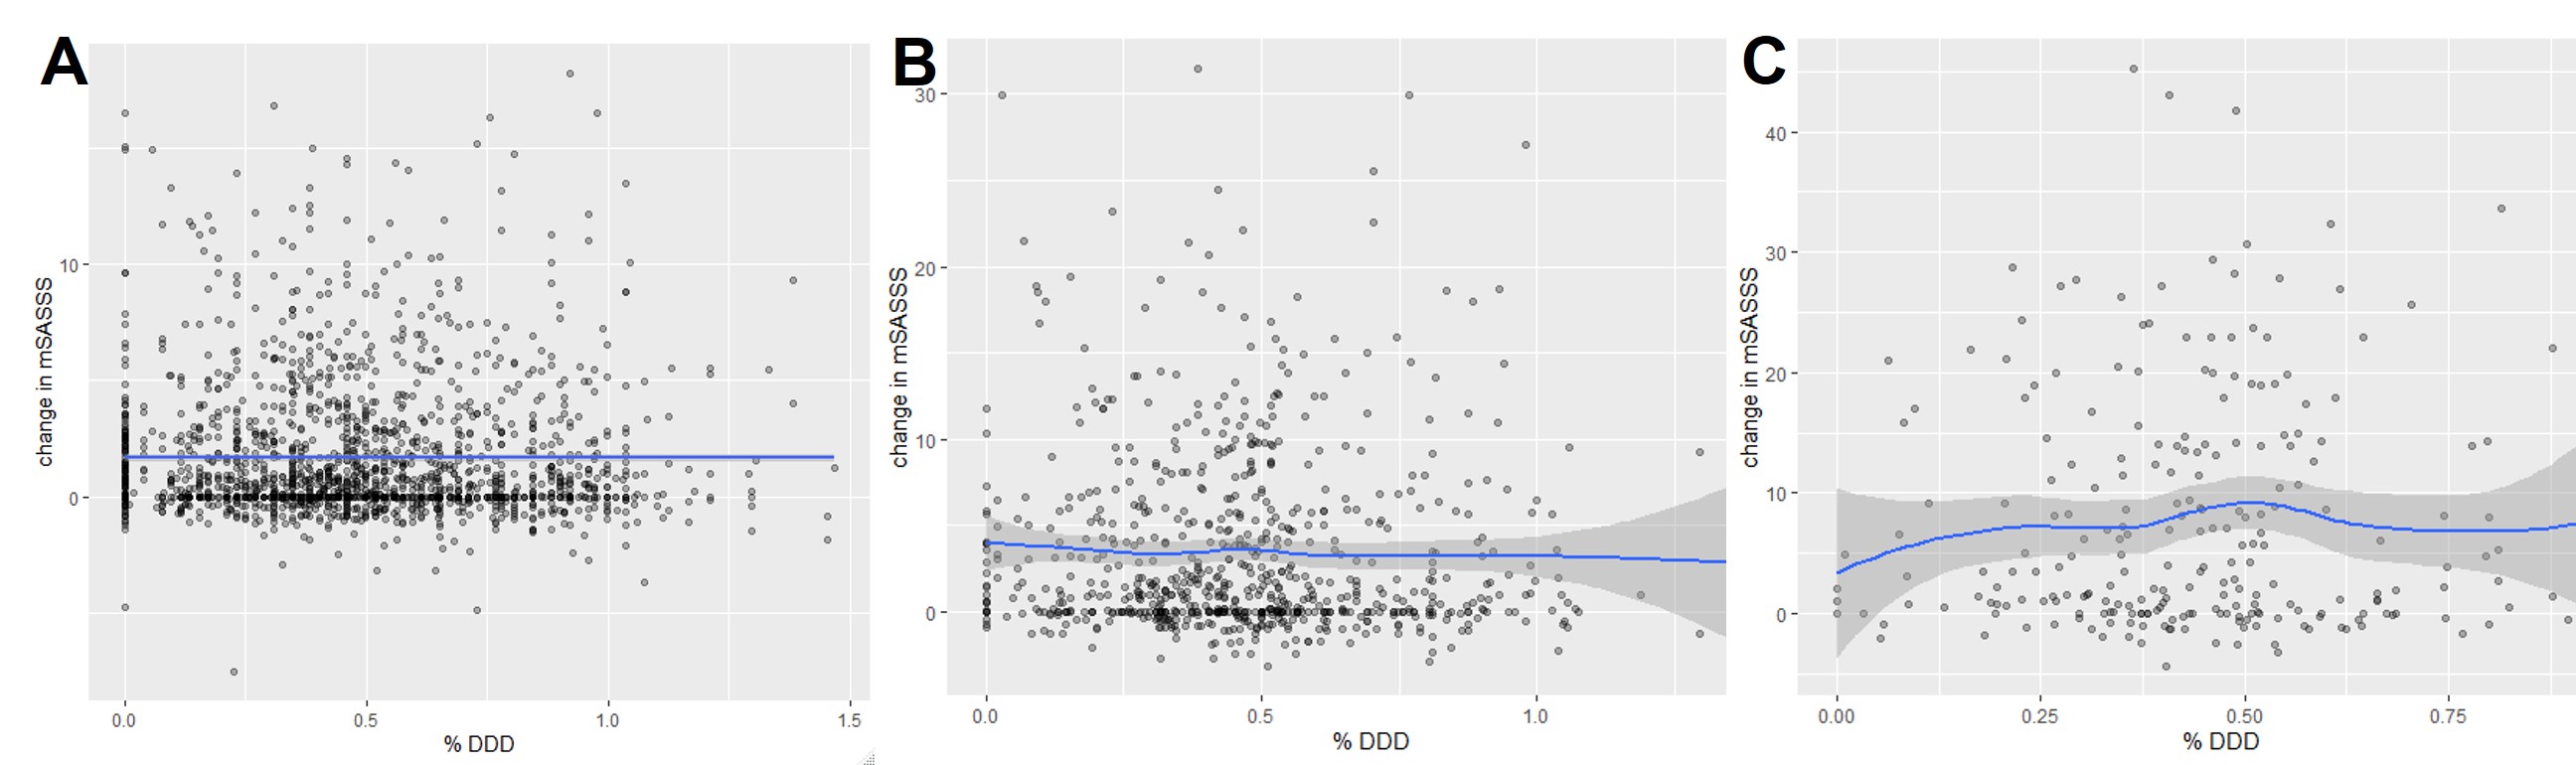
Results: A total of 559 patients were included in the study. The Pearson correlation coefficients of %DDD and changes in mSASSS were -0209 for the 2-year interval, -0.0301 for the 4-year interval, and 0.0315 for the 8-year interval (Figure 1). In linear mixed models, %DDD and the changes of mSASSS at 2 years (β=-0.134, 95% CI -0.629 ‒ 0.362), 4 years (β =-0.733, 95% CI -2.258 ‒ 0.792), and 5 years (β=1.235, 95% CI -5.230 ‒ 7.701) were not statistically significant in any interval (p = 0.597, p = 0.345, p = 0.707, respectively).In the subgroup analysis divided by baseline mSASSS, the correlation between %DDD and the changes of mSASSS was not statistically significant.
Conclusion: There was no correlation between the doses of TNF inhibitors and the changes of mSASSS. Although this study was a retrospective, our findings suggest that dose adjustment of TNF inhibitors may not be correlated with radiographic progression in patients with AS.
Figure 1. Scatterplot of defined daily dose (%DDD of TNF inhibitors ) and change in modified Stoke Ankylosing Spondylitis Spinal Score (mSASSS) at each interval (A: 2-year interval, B: 4-year interval, C: 8-year interval)
B. Koo: None; S. Park: None; J. Shin: None; S. lee: None; k. Joo: None; T. Kim: None.