Brigham and Women's Hospital Brookline, MA, United States
Disclosure information not submitted.
Roopa Madhu1, Kartik Bhamidipati1, Anna Helena Jonsson1, Fan Zhang2, Lucy MacDonald3, Youngmi Kim4, Yi Cui4, STARS BWH1, Accelerating Medicines Partnership Program RA SLE Network5, Mariola Kurowska-Stolarska3, Stefano Alvernini6, Ellen Gravallese7, Michael Brenner7, Soumya Raychaudhuri1, Kevin Wei7 and ilya Korsunsky1, 1Brigham and Women's Hospital, Boston, MA, 2University of Colorado, Aurora, CO, 3Research into Inflammatory Arthritis Centre Versus Arthritis (RACE), University of Glasgow, Glasgow, United Kingdom, 4Nanostring, Seattle, WA, 5Cedars-Sinai Medical Center, Los Angeles, CA, 6Division of Rheumatology, Università Cattolica del Sacro Cuore, Rome, Italy, 7Brigham and Women's Hospital and Harvard Medical School, Boston, MA
Background/Purpose: Rheumatoid arthritis (RA) is an autoimmune disease characterized by immune infiltration of the synovial tissue lining joints. RA is clinically heterogenous, with patients having varied responses to therapies, likely reflecting distinct pathogenic mechanisms. To begin to define the heterogeneity in RA, a recent study showed that the fractional abundances of 5 cell types can help predict treatment response in some subsets of RA (1). With the goal of better understanding the spatial organization of cells in RA synovial tissues and mapping cell-cell interactions, we sought to take a key next step in defining RA heterogeneity and its relation to treatment response
Methods: Spatial transcriptomic profiling
We used CosMx Spatial Molecular Imager to measure the RNA expression levels of 960 genes in 10 paraffin-embedded inflamed synovial tissue samples.
Cell segmentation and annotation
We developed a segmentation pipeline to map transcripts to cells, and then classified each cell into one of 10 major cell types. We used the single-cell RNA seq synovial atlas to map these cells further into fine-grained cell-states.
Niche detection and characterization
We performed spatial tissue segmentation to identify contiguous and transcriptionally homogeneous sections of the tissue called "niches". We split tissues into tiles and performed spatial clustering of the tiles to detect niches.
Results: 1. Identification of major and fine-grain cell types in situ. We segmented and labeled 333,966 high quality cells across 10 RA synovial tissue samples. We identified 10 major cell lineages (Figure 1A-B), including 2 absent in single-cell RNA-seq studies: mast cells and neutrophils. We subclassified cells into 54 subtypes and activation states based on prior definitions from the AMP single-cell RNA-seq atlas of inflamed synovium (1). We detected 2 cell states of mast cells (resting and activated) and 3 cell states of neutrophils (resting, activated, and proliferating) based on key gene expression markers.
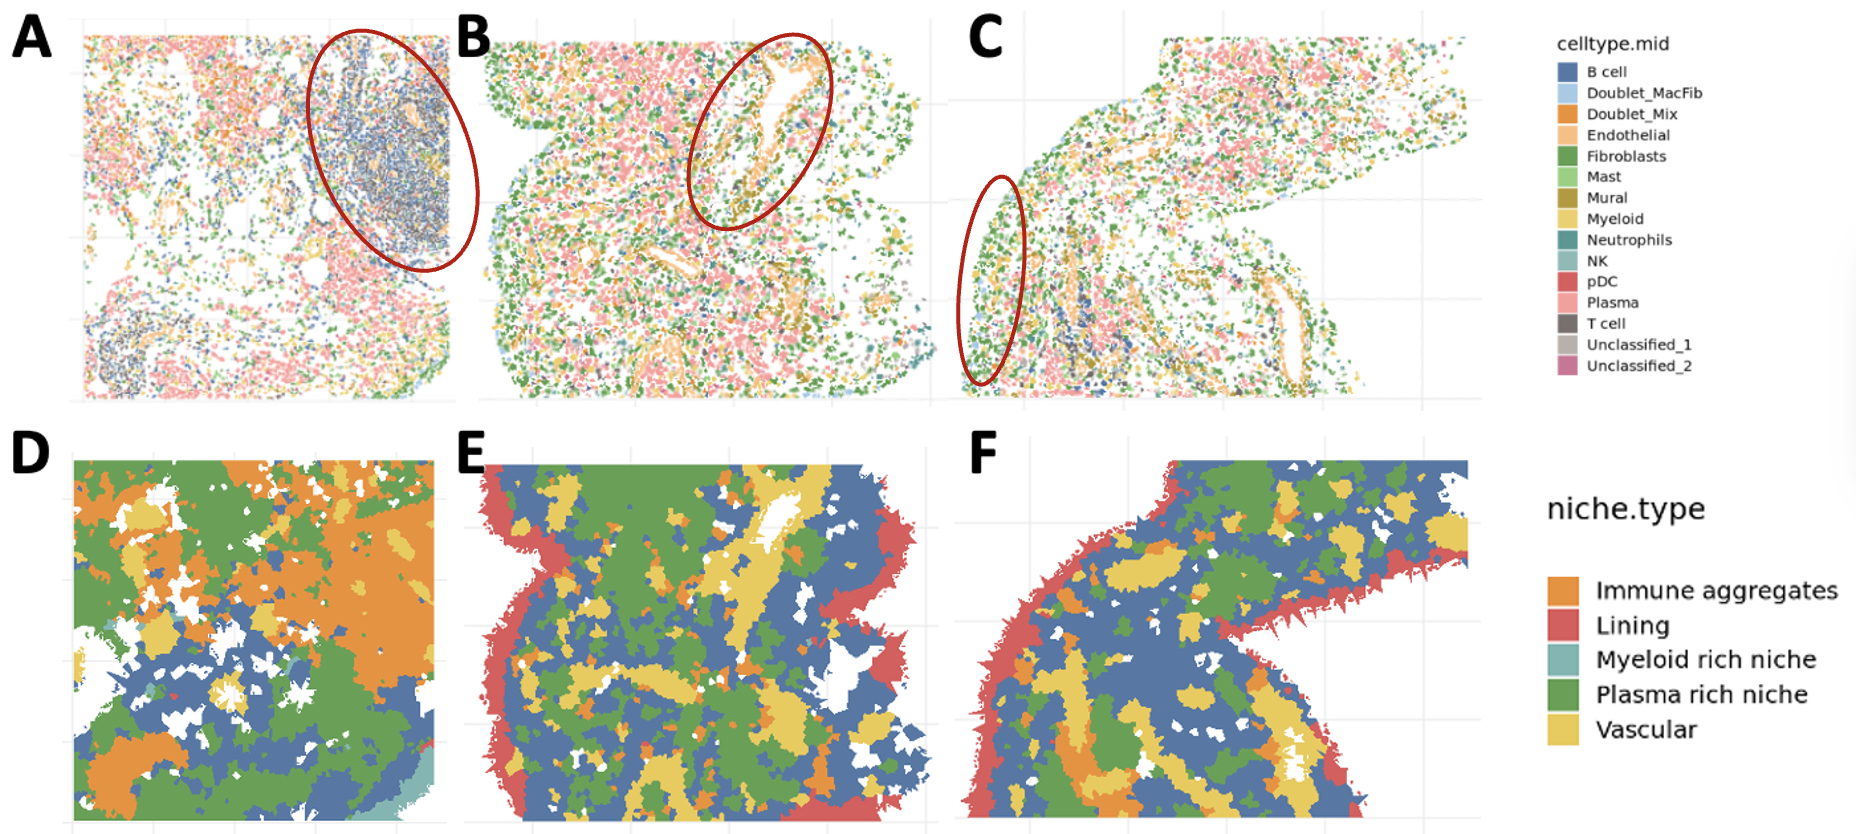
2. Quantification of anatomic niches. We mapped annotated cells into tissue space, where they organized into anatomic structures: vasculature (endothelial and mural cells), lining (lining fibroblasts and MERTK+ macrophages), and immune aggregates (T, B, and plasma cells) (Figure 2A-C). We quantified the boundaries of these niches and identified all niches in most samples. We next quantified the relative composition of niches within and across donors and observed significant heterogeneity of niches within samples (Figure 2D-F).
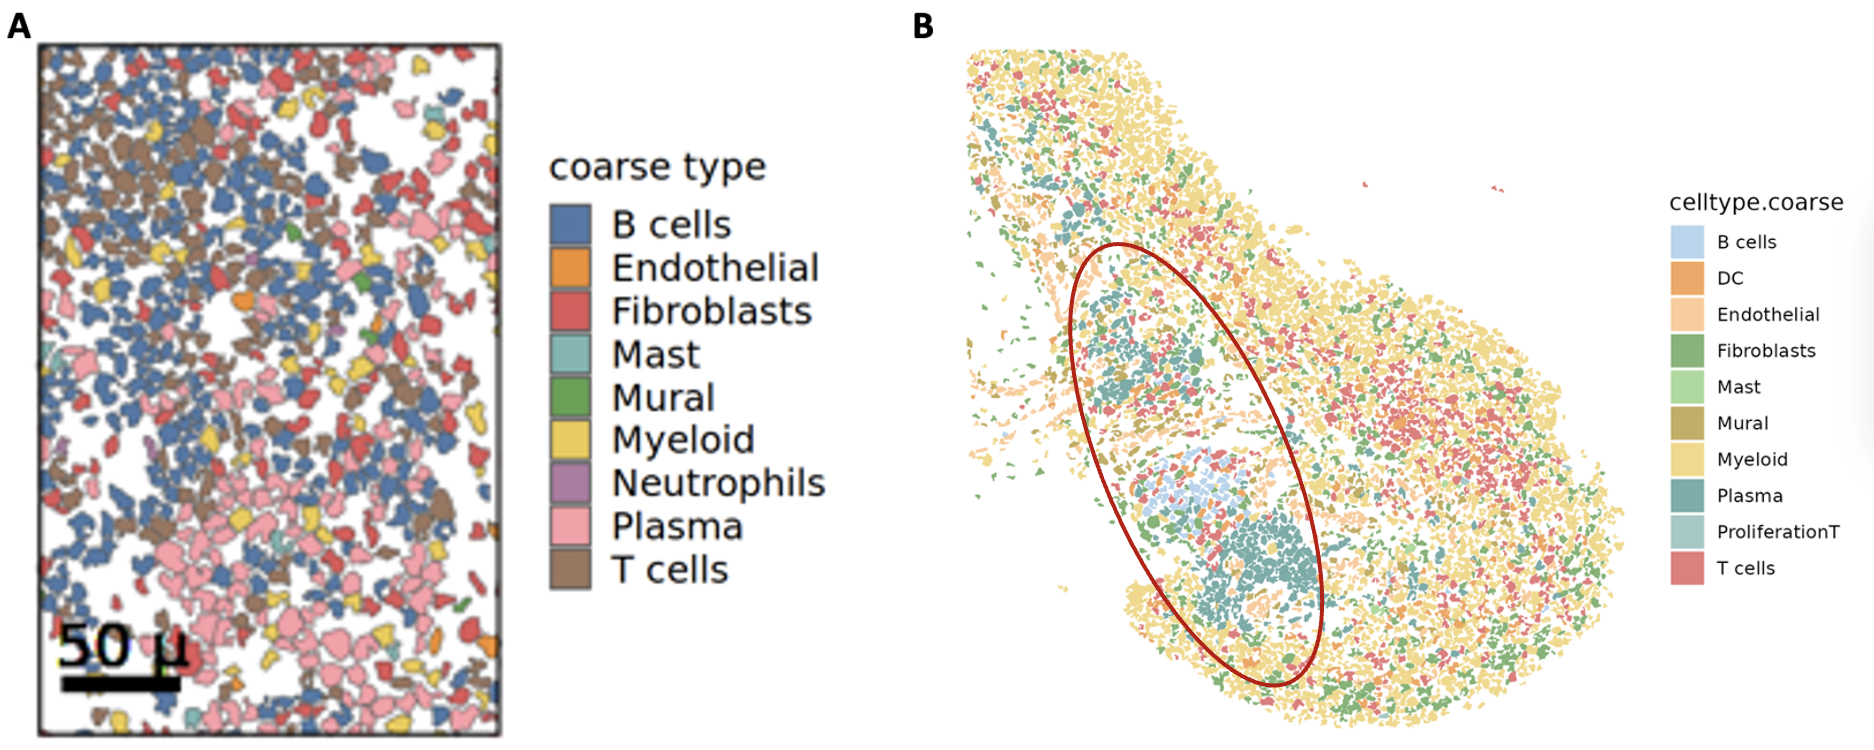
3. Validation with independent cohort. We validated our spatial organization results in an independent inflamed synovial tissue cohort from 3 patients with treatment naïve RA. Using our pipeline, we found similar proportions of cell types and organization of cells into the canonical niches defined in our spatial atlas (Figure 3A, B).
Conclusion: We established a draft spatial atlas of RA synovium and provided spatial context for 54 cell types, subtypes, and activation states observed in dissociated tissue assays. This atlas will serve as a reference to map the cellular organization in different cohorts as demonstrated and eventually enable us to compare the effects of different therapeutics on the RA tissue.
Identification of major cell types in situ (A) Cells projected in UMAP space, colored by their major cell type. (B) Heatmap of gene log fold-changes for each of the major cell types. Top 3 marker genes for each cluster are annotated on the x-axis.
Identification of anatomical niches (A-C) Cells in tissue space in active RA synovium. Each panel shows an FOV from a tissue sample. Red ovals in each FOV highlight an anatomical niche (A) immune aggregate, (B) vascular niche, (C) lining. (D-F) Niches in space: each panel shows detected niches in the FOVs shown in A-C. FOV: Field of view
Anatomical niches across cohorts (A) Cells in tissue space in active RA synovium organized into an immune aggregate (B) Cells in tissue space in treatment naïve RA synovium. Red oval highlights the immune aggregate niche.
R. Madhu: None; K. Bhamidipati: None; A. Jonsson: None; F. Zhang: None; L. MacDonald: None; Y. Kim: NANOSTRING, 3; Y. Cui: NANOSTRING, 3; S. BWH: Mestag Therapeutics, 2; A. RA SLE Network: None; M. Kurowska-Stolarska: None; S. Alvernini: None; E. Gravallese: Associate Editor, New England Journal of Medicine, 3, Co-editor of the textbook Rheumatology, 9, UptoDate, 9; M. Brenner: 4FO Ventures, 2, GlaxoSmithKlein(GSK), 2, Mestag Therapeutics, 2, 11, Third Rock Ventures, 2; S. Raychaudhuri: AbbVie, 6, Janssen, 1, Mestag, Inc, 2, 8, Pfizer, 1, Sanofi, 1, Sonoma, 1, 8; K. Wei: 10X Genomics, 5, capital one, 6, Gilead sciences, 5, horizon therapeutics, 6, Mestag, 2; i. Korsunsky: Mestag Therapeutics, 2.