Session: (0543–0581) SLE – Diagnosis, Manifestations, & Outcomes Poster I
0547: A Spatially-resolved Single Cell Resolution Atlas of Pediatric Lupus Nephritis Uncovers Complex Interactions Between Stromal and Infiltrating Immune Cells
Seattle Children's Research Institute Seattle, WA, United States
Disclosure information not submitted.
Shaun Jackson1, Nicholas Hasle2, Elizabeth Nguyen3, Robyn Reed2 and Patrick Danaher4, 1Seattle Children's Research Institute / University of Washington, Seattle, WA, 2Seattle Children's Hospital/University of Washington, Seattle, WA, 3Seattle Children's Research Institute, Seattle, WA, 4Nanostring, Inc., Seattle, WA
Background/Purpose: The molecular and cellular heterogeneity of human Lupus Nephritis (LN) at the kidney tissue level makes it challenging to identify key disease drivers and therapeutic targets. Single-cell transcriptomics (scRNA-Seq) has advanced our understanding of LN pathogenesis, but tissue dissociation eliminates all spatial information and several rare cell types (such as podocytes) are under-represented using droplet-based scRNA-Seq protocols. Using a technical advance in spatial transcriptomics, we generated a spatially-resolved, single cell resolution atlas of childhood-onset lupus nephritis.
Methods: Using the CosMx SpatialMolecular Imager (Nanostring), we generated single cell-resolution spatial transcriptomic data on archived kidney biopsy tissue from 8 pediatric Class III/IV LN patients and 2 health controls.
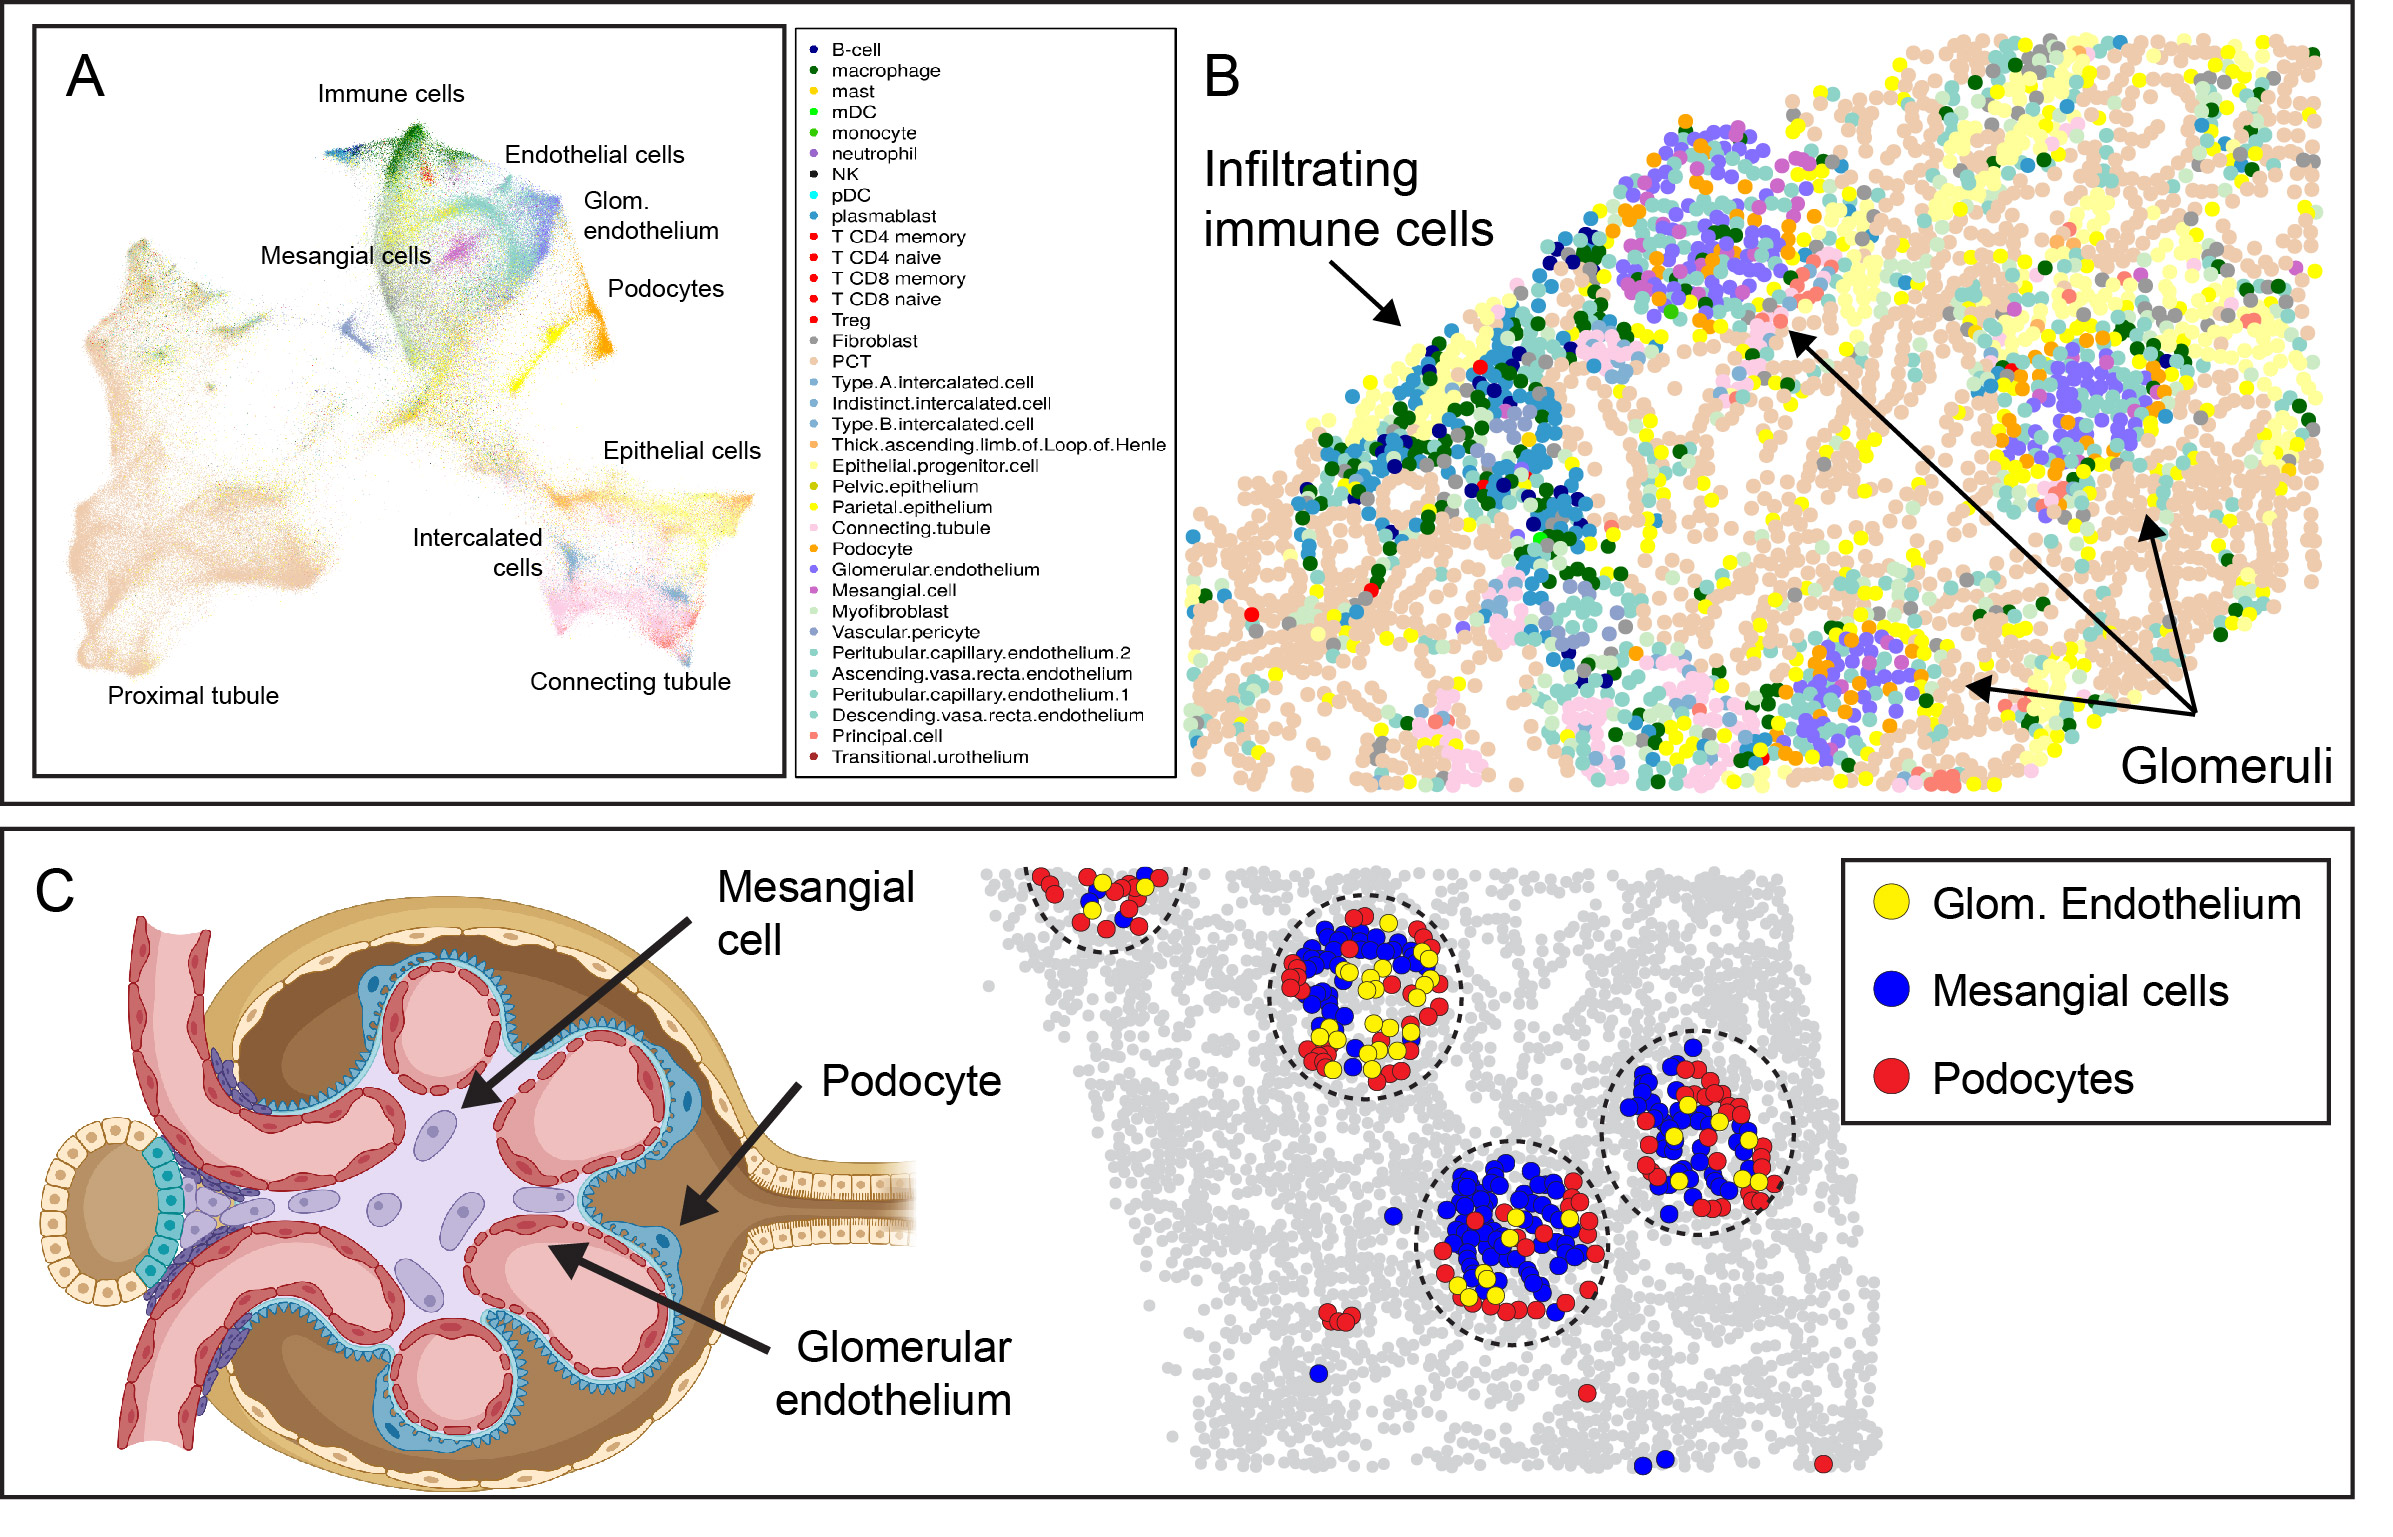
Results: After data QC and cell segmentation, we identified a total of 447,892 cells, which were assigned to 33 reference cell types (Fig. 1A). Visualizing spatial relationships provided robust evidence of the accuracy of cell annotation, such as the colocalization of fenestrated glomerular endothelial cells, mesangial cells, and podocytes within glomeruli (Fig. 1B, C).
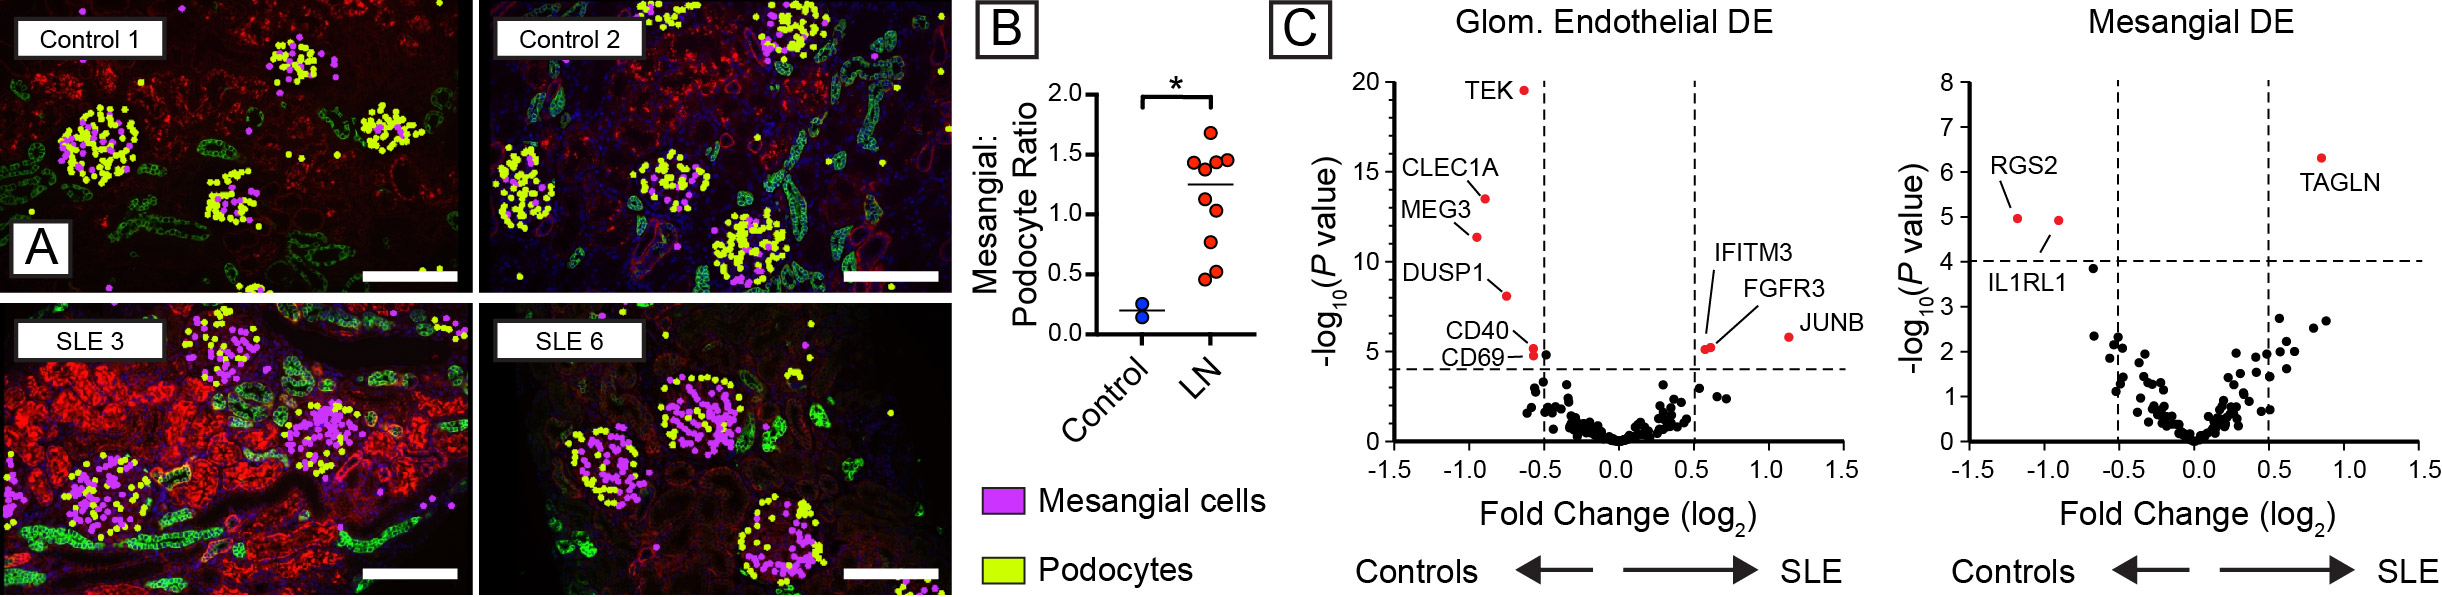
As predicted by the biology of immune complex glomerulonephritis, the proportion of mesangial cells was broadly increased in LN, while relative podocyte numbers declined (Fig. 2A, B). Analysis of differential gene expression demonstrated that SLE induced broad transcriptional changes in resident glomerular cells (Fig. 2C). For example, glomerular endothelial cells downregulate expression of TEK (encoding the angiopoietin-1-binding TEK receptor tyrosine kinase), the angiopoietin-1/TEK signal regulator DUSP1 (Dual Specificity Phosphatase 1), and CLEC1A(encoding the C-type lectin domain family 1 member A), suggesting altered glomerular endothelial function and cross-talk with surrounding mesangial matrix. Amongst the upregulated genes in LN mesangial cells, TAGLN, encoding transgrelin, is a marker for proliferating mesangial cells responding to tissue injury. Mesangial cells in LN also upregulated collagen molecules (COL3A1, COL1A2, COL4A1, COL6A), matrix metalloproteinases and inhibitors (MMP14, MMP19, TIMP1), and chemokines (CSF1, CXCL9).
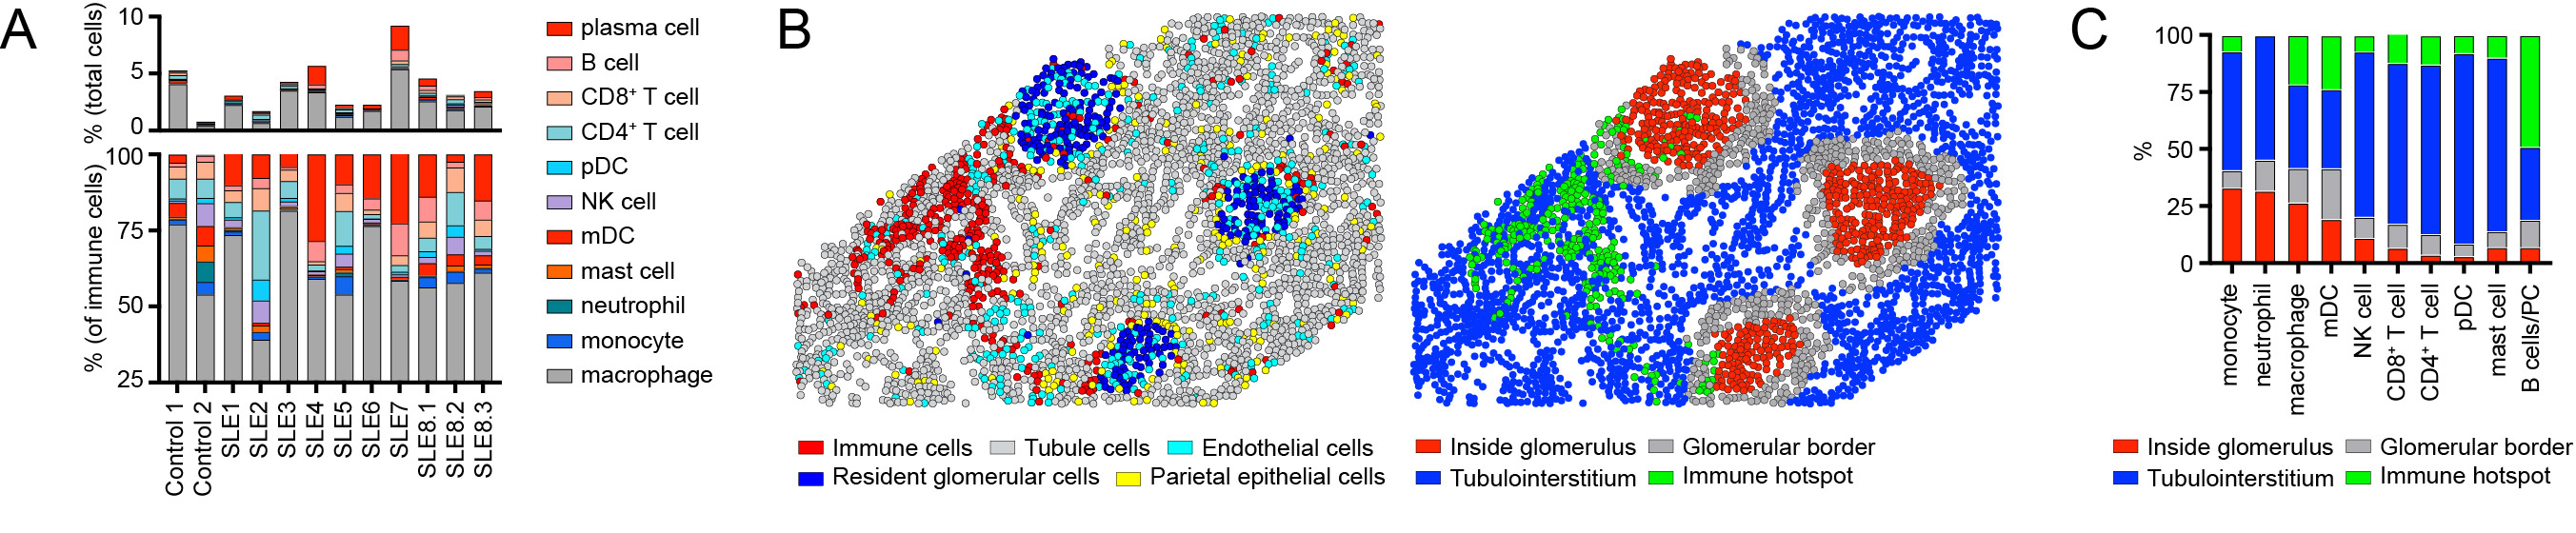
Focusing on immune cell infiltrates, LN was characterized by the relative expansion in B cells, plasma cells, and plasmacytoid dendritic cells (pDCs) within the kidney parenchyma (Fig. 3A). Notably, individual immune lineages traffic to specific regions in LN kidneys (Fig. 3B, C), while the transcriptional signatures of these cells also varied as a function of tissue location (not shown).
Conclusion: Spatial transcriptomics is a powerful tool to uncover the heterogeneity of LN. Our data highlight how gene expression in resident kidney cells and infiltrating immune cells varies as a function of both disease state and spatial location. The identification of new pathogenic mechanisms may inform the development of new targeted therapies.
Figure 1: (A) UMAP projection of immune and renal cell subsets in LN. (B) Spatial relationships with each dot indicating a single cell. Arrows denote glomeruli and infiltrating tubulointerstitial immune cells. (C) Left: Illustration showing major glomerular cell types. Right: Glomerular cell types are spatially confined to glomerular structures (dashed circle), with podocytes (red) predominantly located peripherally outside mesangial and endothelial cells. Grey dots: unlabeled cells.
Figure 2: (A) Representative image showing mesangial hypercellularity in proliferative LN relative to controls. (B) Increased mesangial cell:podocyte ratio in LN. (C) Volcano plot showing differentially expressed genes (DEG) in childhood-onset LN relative to healthy controls.
Figure 3: (A) Immune cell distribution in 8 LN patients vs. 2 healthy controls. (B) Image showing the computational identification of kidney regions (defined as: i) inside glomeruli; ii) bordering glomeruli; iii) within the kidney tubulointerstitium; and i) within immune hotspots). Left panel: cell types. Right panel: kidney spatial regions. (C) Distribution of infiltrating immune cells into kidney spatial regions in LN.
S. Jackson: None; N. Hasle: Bristol-Myers Squibb(BMS), 3; E. Nguyen: None; R. Reed: None; P. Danaher: Nanostring, Inc., 3, 11.


.png "Shaun Jackson, MD, PhD photo")