Victoria Konzett1, Andreas Kerschbaumer2, Josef S Smolen3, Eirik Kristianslund4, Sella Provan4, Tore Kvien5 and Daniel Aletaha6, 1Medical University of Vienna, Wien, Austria, 2Medical University of Vienna, Vienna, Austria, 3Division of Rheumatology, Department of Internal Medicine III, Medical University of Vienna, Vienna, Austria, 4Diakonhjemmet Hospital, Oslo, Norway, 5Center for Treatment of Rheumatic and Musculoskeletal Diseases (REMEDY), Diakonhjemmet Hospital, Oslo, Norway, 6Division of Rheumatology, Department of Medicine III, Medical University of Vienna, Vienna, Austria, Wien, Austria
Background/Purpose: Measures of improvement and state of disease activity are well-established in rheumatoid arthritis (RA), whereas distinct classifiers for worsening (“flare”) are lacking to date. Definitions of flare are highly warranted for novel treatment strategies that aim for drug tapering or withdrawal in patients on treatment target. We therefore aim to provide preliminary definitions of flare, based on the Simplified and Clinical Disease Activity Indices (SDAI, CDAI).(1)
Methods: We analysed RA treatment courses from the Norwegian DMARD registry (NOR-DMARD) and the Vienna RA cohort. In a receiver operating curve (ROC) analysis, we determined distinct cut points for absolute worsening in SDAI and CDAI based on a semiquantitative patient anchor (for details see legend figure 1). We separated the NOR-DMARD dataset into a training and test cohort by 8:2 random sampling. For internal validation, we performed bootstrapping in the training cohort and evaluated performance in the test cohort. We then validated the definitions externally in the independent Vienna RA cohort, and determined their performance on content, construct, longitudinal, and face validity.
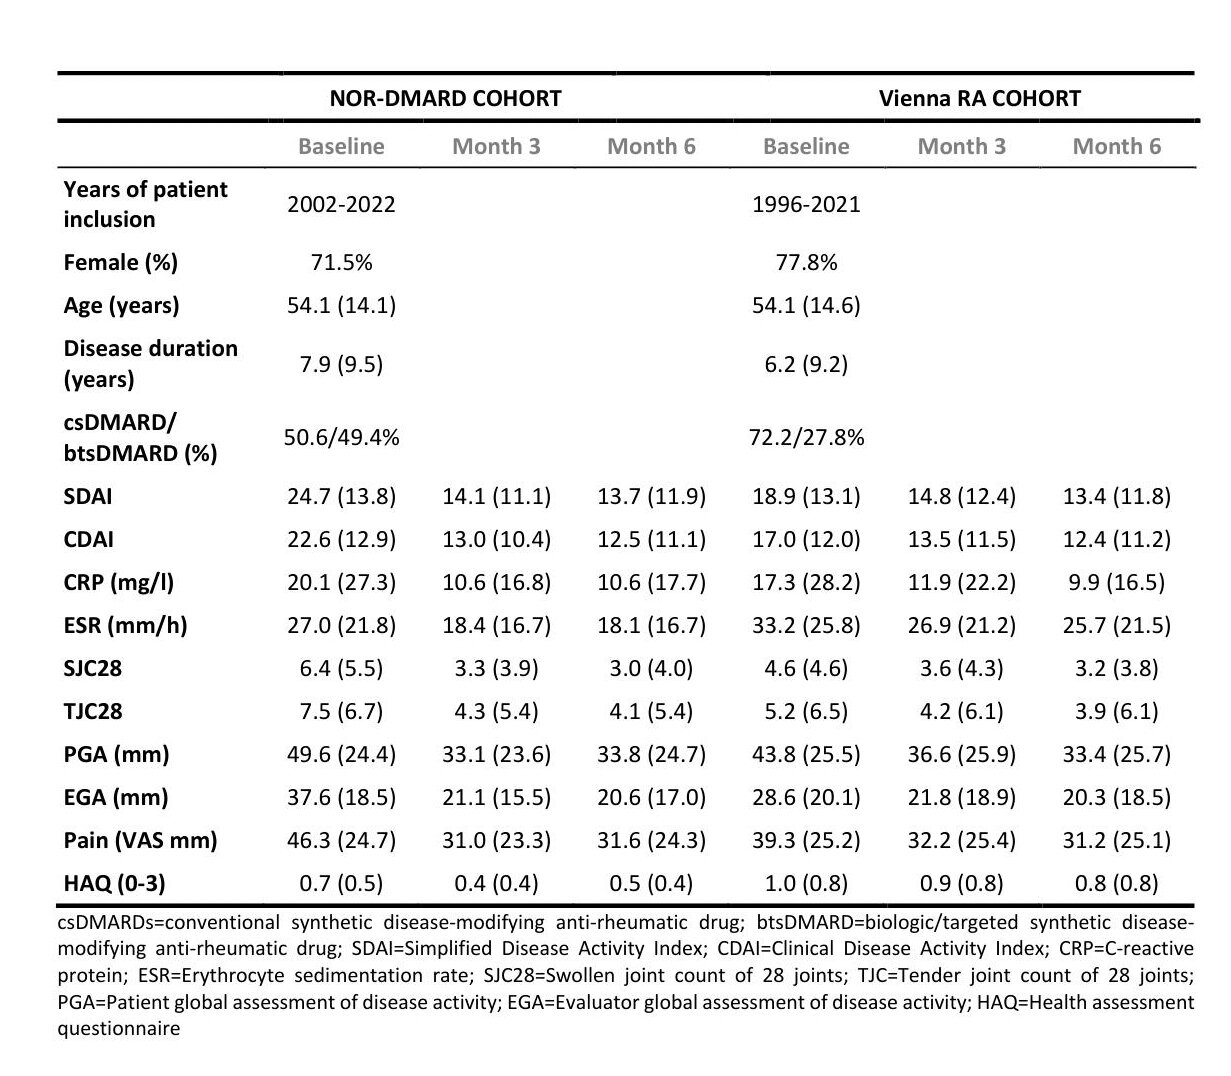
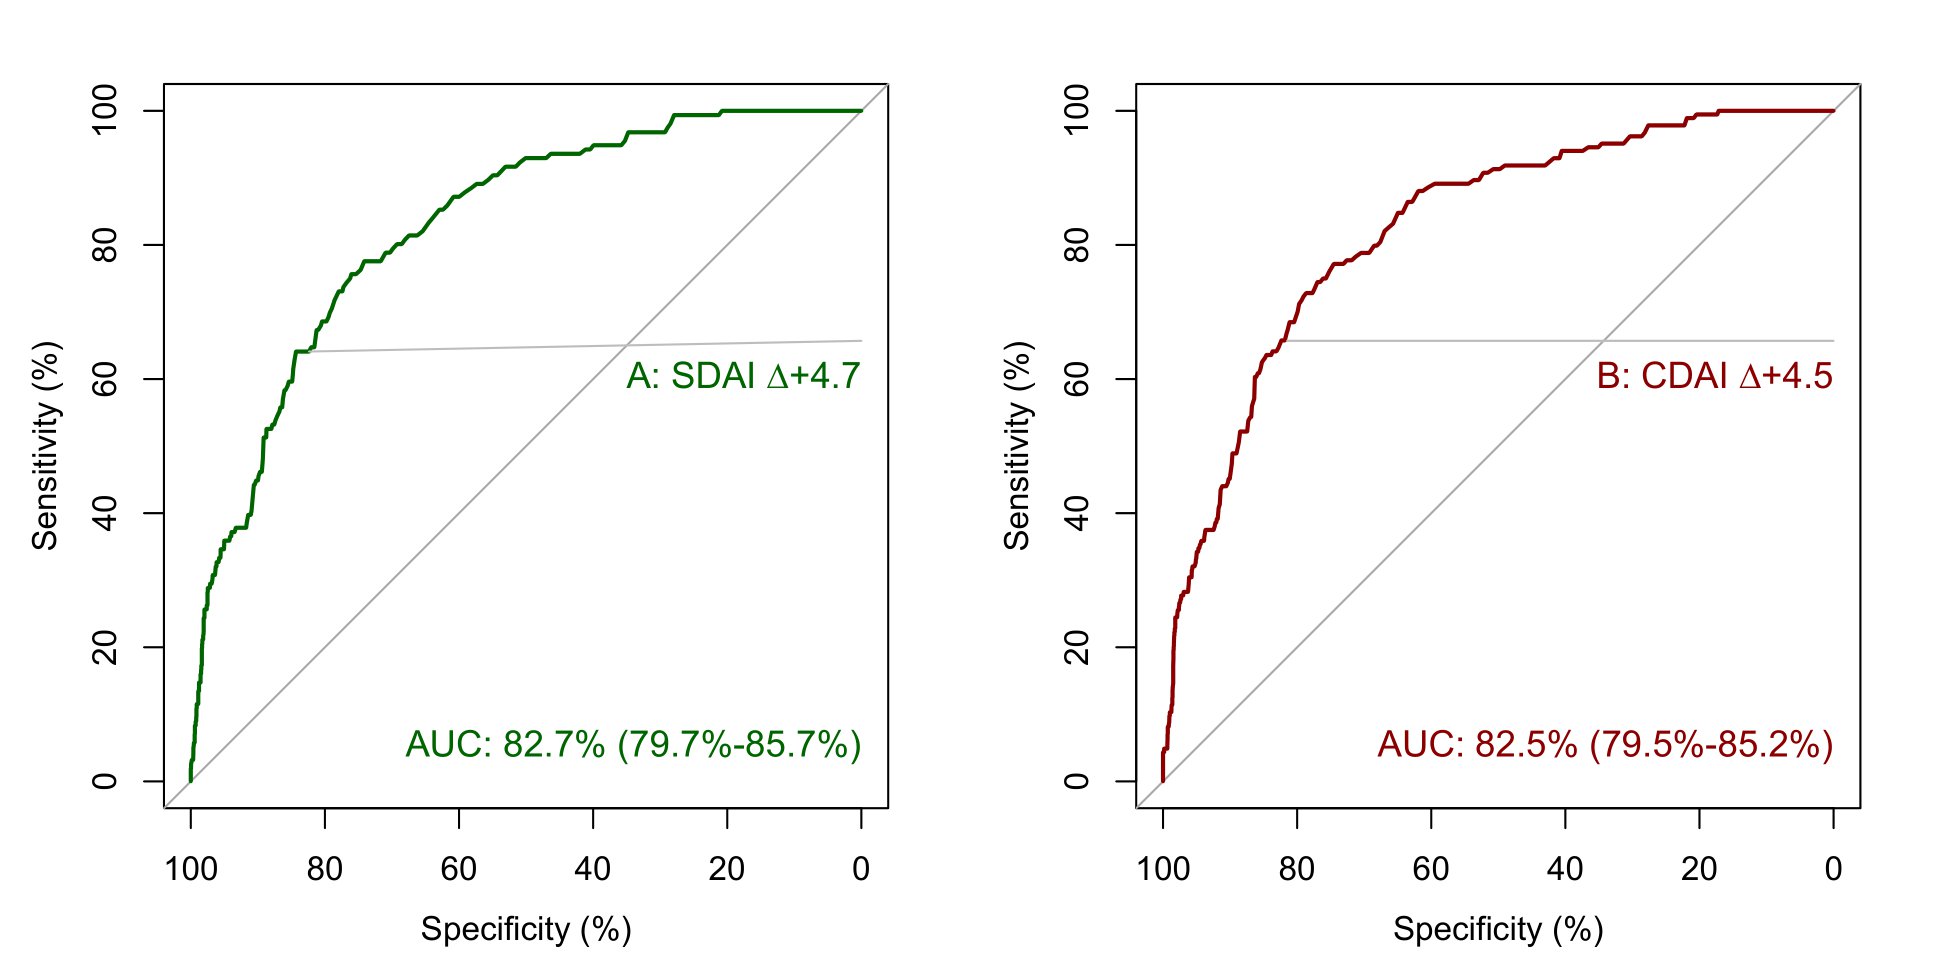
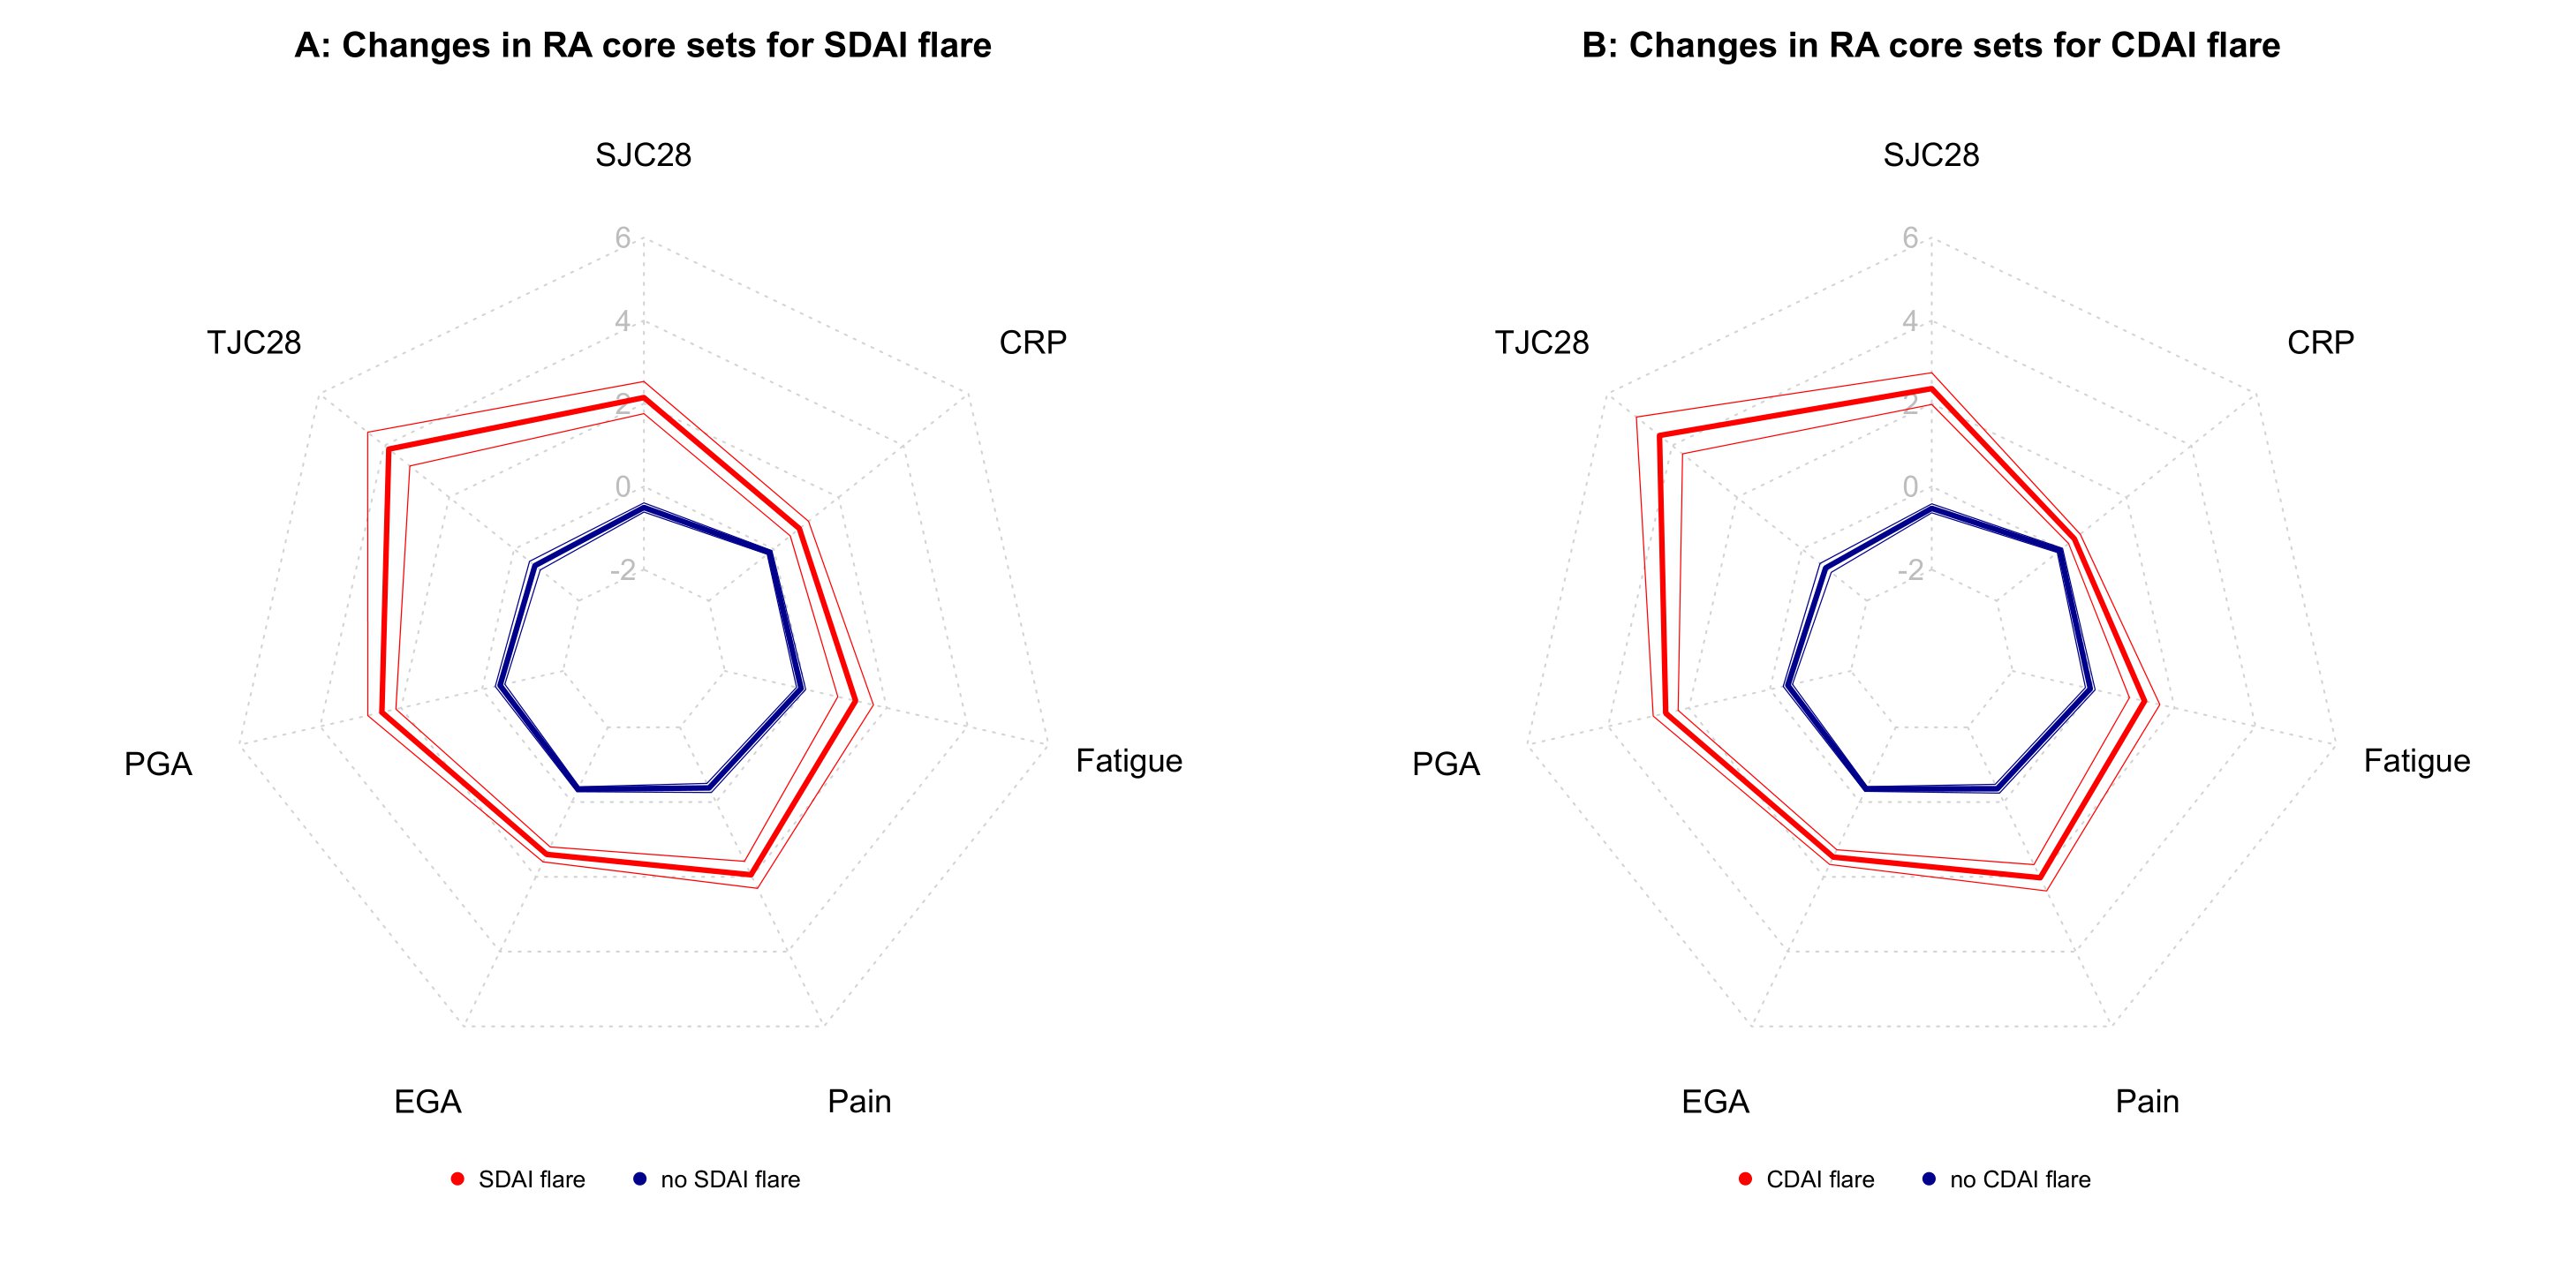
Results: We analyzed 4256 treatment courses in the NOR-DMARD registry and 2557 in the Vienna RA cohort (table 1). The preliminary definitions for absolute changes in SDAI and CDAI for flare are an increase of 4.7 and 4.5, respectively (figure 1). These cut points performed well in the NOR-DMARD test cohort and the external validation cohort. When flaring, patients showed worsening in all disease activity core set variables, including both patient reported and objective measures (figure 2), and were more frequently subjected to subsequent treatment changes (p< 0.001). Flares substantially impacted both functional and structural disease outcomes (increase in Health Assessment Questionnaire score, ΔHAQ,(2) for flare vs. no flare +0.44, p< 0.001; radiographic progression, Δmodified Sharp Score,(3) 43% higher after flare vs. no flare visits, 95%-CI 1.04-1.96, p< 0.001). This underlines clinical face and construct validity of the novel definitions.
Conclusion: We here provide novel preliminary definitions for flare in RA based on changes in SDAI and CDAI. In times of highly effective treatments available for RA, and consideration of treatment tapering or withdrawal, these definitions will be useful for guiding decision making in clinical practice and designing clinical trials.
References
Smolen JS, Aletaha D. Scores for all seasons: SDAI and CDAI. Clin Exp Rheumatol. 2014;32(5 Suppl 85):S-75-9.
Fries JF, Spitz P, Kraines RG, Holman HR. Measurement of patient outcome in arthritis. Arthritis Rheum. 1980;23(2):137-45.
van der Heijde D. How to read radiographs according to the Sharp/van der Heijde method. J Rheumatol. 2000;27(1):261-3.
Table 1 Baseline, three- and six-month data from the NOR-DMARD main analysis cohort and the Vienna RA validation cohort (no. of treatment cycles: 4256 and 2557, respectively); values are given in percent, or as mean and standard deviation
Figure 1 Receiver operating curves (ROC) to derive cut points for absolute changes in SDAI (A) and CDAI (B); based on a semiquantitative patient anchor from NOR-DMARD, where patients reported their perception of response to DMARD treatment compared to baseline on a five-point Likert scale (much worse – worse – unchanged – better – much better). Flare was defined as worsening of at least two points on the Likert scale, compared to the assessment at month three; 95%-confidence intervals for the area under the receiver operating curve (AUC) were estimated using bootstraps with 1000 resamples.
Figure 2 Content validity analysis; spider charts illustrate internal consistency of the novel definitions (A: SDAI ∆+4.7; B: CDAI ∆+4.5) across all rheumatoid arthritis core sets, tested in 1252 visits of 329 patients in the Vienna RA cohort; evaluator global (EGA), patient global (PGA), pain, and fatigue are given in cm; C-reactive protein (CRP) in mg/dl; thin borders mark 95%-confidence intervals