University of Pittsburgh Medical Center Wexford, PA, United States
Disclosure information not submitted.
Mehreen Elahee1, Kathryne Marks2, Ifeoluwakiisi Adejoorin2, Lin Chen2, Derrick Todd2, Jonathan Coblyn2, Elena Massarotti2, Susan Ritter2, Michael Weinblatt3, Daniel Solomon4 and Deepak Rao2, 1University of Pittsburgh Medical Center, Pittsburgh, PA, 2Brigham and Women's Hospital, Boston, MA, 3Harvard Medical School, Waban, MA, 4Brigham and Women's Hospital, Newton, MA
Background/Purpose: There are multiple DMARDs available to treat rheumatoid arthritis (RA) yet there are no widely used predictive biomarkers to guide selection of a specific DMARD. We hypothesize that immunophenotyping of blood immune cells will provide potential biomarkers associated with response to specific DMARDs. We profiled circulating lymphocytes in RA patients before and after treatment with JAK inhibitors (JAKi) or anti-TNF (aTNF) to identify immune cell features associated with treatment response.
Methods: We applied single-cell RNA sequencing (scRNA-seq) and mass cytometry to PBMCs from RA patients before and after treatment with JAKi (scRNAseq n=19, mass cytometry n=27) or aTNF (scRNAseq n=9, mass cytometry n=32) as prescribed by treating physician. RA patients met ACR/EULAR 2010 classification criteria, and treatment response was ascertained by CDAI and medical record review. T cell subsets were identified by unsupervised analysis and specific populations were validated by biaxial gating. Wilcoxon paired tests were used for comparison between the timepoints and Mann-Whitney was used to compare responders vs non-responders.
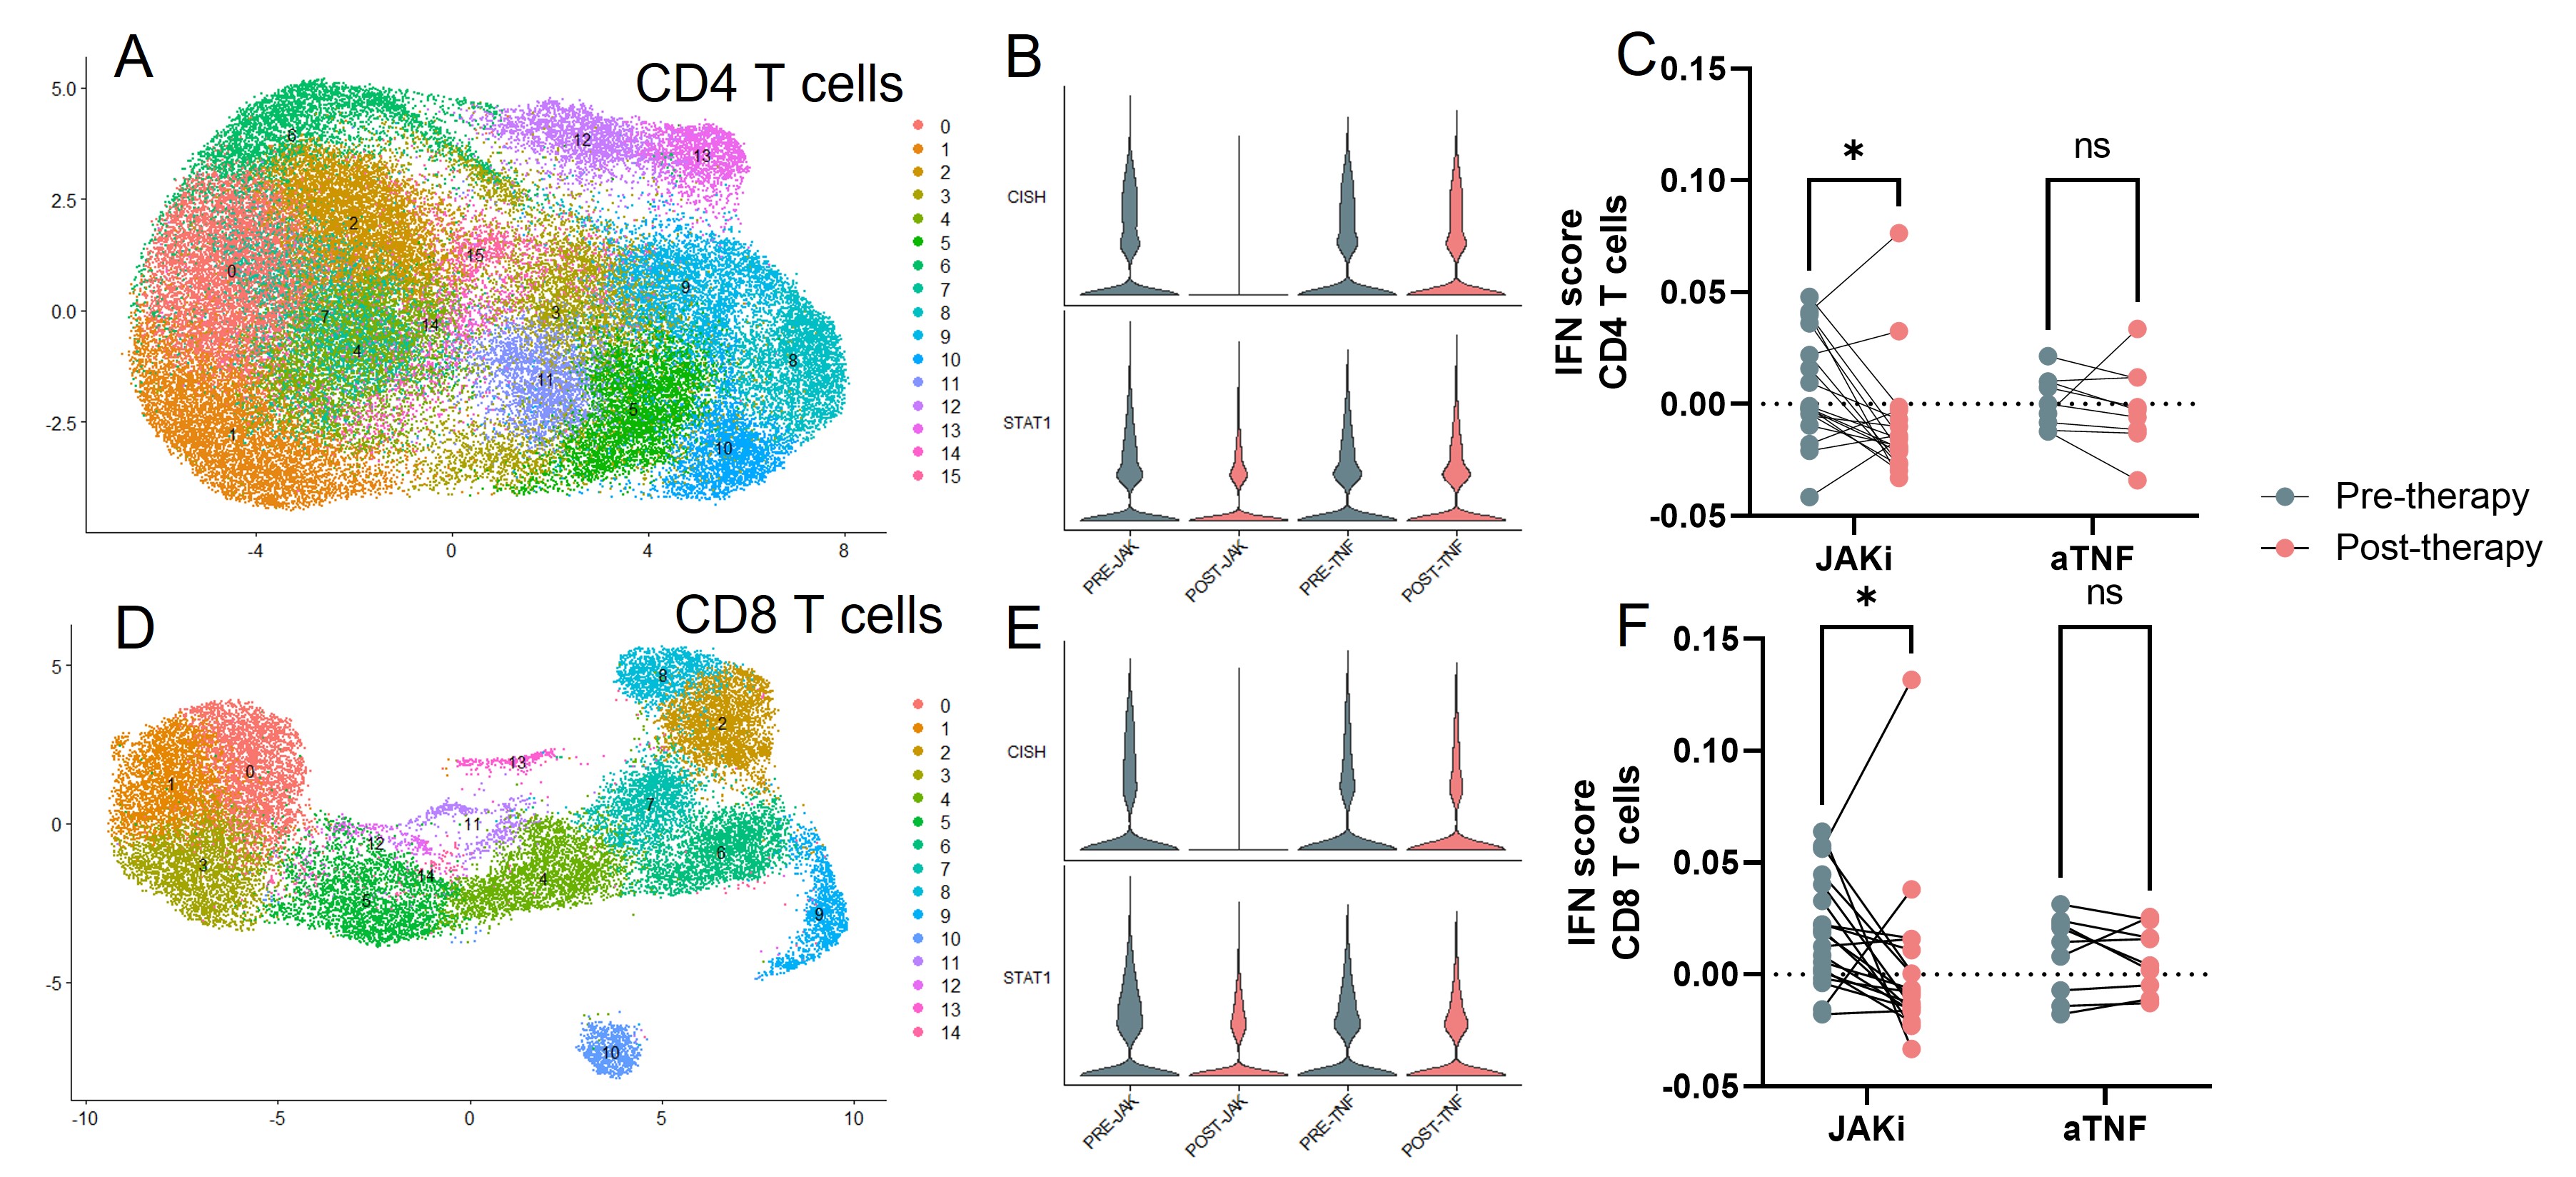
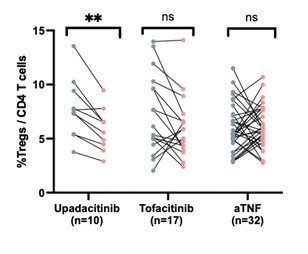
Results: Comparison of lymphocytes from RA patients before and after treatment with JAKi by scRNA-seq revealed changes in lymphocyte transcriptomic signatures, including reduction in JAK signaling-associated genes such as CISH, SOCS2, and STAT1 and reduction in interferon-stimulated genes, consistent with effective JAK inhibition. These changes occurred similarly in JAKi responders and non-responders, yet they were not observed in the aTNF-treated cohort. Comparison of lymphocyte populations pre- and post-JAKi treatment revealed several changes in T cell composition, including a reduction in a regulatory T cell (Treg) subset following treatment with upadacitinib but not tofacitinib or aTNF. Comparing pre-treatment samples from responders and non-responders, we observed higher frequencies of a PD-1hi CD4 T peripheral helper (Tph) cell cluster and an activated CD8 T cell cluster in JAKi responders compared to non-responders at baseline. Both of these cell clusters had high expression of the proliferation marker Ki67 and increased expression of a gene signature associated with proliferation. These proliferating clusters did not differ between responders vs non-responders in the aTNF-treated cohort.
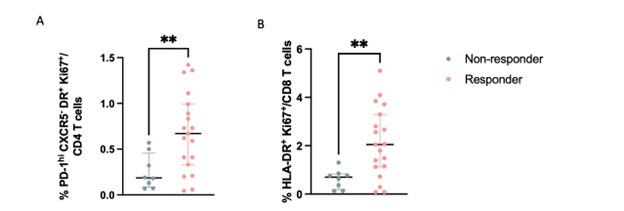
Unsupervised analysis of mass cytometry data from a larger cohort of JAKi-treated patients similarly identified a reduced Treg frequency in patients treated with upadacitinib and higher frequency of Ki67+ HLA-DR+ Tph cells and Ki67+ HLA-DR+ CD8 T cells specifically in JAKi responders compared to non-responders, but not in the aTNF-treated cohort. Cells in the JAKi responder-associated clusters were characterized by expression of CD38 and PD-1. Biaxial gating on Ki67 and HLA-DR reproduced results from unsupervised clustering.
Conclusion: Broad lymphocyte immunophenotyping revealed a signature of proliferating lymphocytes in blood that was enriched in JAKi responders but not aTNF responders. These results suggest that cellular features detectable in blood may be leveraged as predictive biomarkers and may distinguish likelihood of response to different DMARD therapies.
Figure 1. A) UMAP visualization of single cell RNA sequencing of CD4 T cells. B) Expression of CISH and STAT1 in CD4 T cells before and after JAKi or aTNF therapy. C) IFN gene module score in CD4 T cells of each sample before and after JAKi or aTNF therapy. D)UMAP visualization of single cell RNA sequencing of CD8 T cells. E)Expression of CISH and STAT1 in CD8 T cells before and after JAKi or aTNF therapy. F) IFN gene module score in CD8 T cells of each sample before and after JAKi or aTNF therapy.
Figure 2. Frequency of regulatory T cells (CD25+FoxP3+) in CD4+ T cells as measured by mass cytometry. Frequencies are shown before and after upadicitinib, tofacinitib, or anti-TNF therapies (**p<0.001 by Wilcoxon signed-rank test).
Figure 3. A) Frequencies of PD-1hiCXCR5-HLA-DR+Ki67+ CD4 T cells in responders and non responders to JAKi as measured by mass cytometry (**p<0.001 by Mann-Whitney) B) Frequencies of HLA-DR+Ki67+ CD8 T cells in responders and non responders to JAKi as measured by mass cytometry (**p<0.001 by Mann-Whitney).
M. Elahee: None; K. Marks: None; I. Adejoorin: None; L. Chen: None; D. Todd: None; J. Coblyn: None; E. Massarotti: None; S. Ritter: Pfizer, 3; M. Weinblatt: Abbvie, 2, 5, Aclaris, 2, Amgen, 2, Aqtual, 5, Bristol Myers Squibb, 2, 5, Canfite, 11, Corevitas, 2, CorEvitas, 2, Eli Lilly, 2, Gilead, 2, 2, Glaxo Smith Kline, 2, Horizon, 2, Inmedix, 11, Janssen, 5, Johnson and Johnson, 2, Pfizer, 2, Prometheus Laboratories, 2, Rani, 2, Revolo, 2, Sanofi, 2, Sci Rhom, 2, Scipher, 2, 11, Set Point, 2, UCB, 2; D. Solomon: CorEvitas, 5, Janssen, 5, Moderna, 5, Novartis, 5; D. Rao: AstraZeneca, 2, Bristol-Myers Squibb, 2, 5, GlaxoSmithKlein(GSK), 2, Hifibio, 2, Janssen, 5, Merck, 5, Scipher Medicine, 2.