1589: Epigenetic Regulation of DNMT3A by TFEB and DOT1L Through AMPK Signalling Orchestrates the Lysosomal Response of Macrophages During Gout and Clonal Hematopoiesis
University of California San Diego San Diego, CA, United States
Disclosure information not submitted.
Isidoro Cobo1, Jessica Murillo-Saich2, Mohnish Alishala1, Stephen Calderon1, Roxana Coras3, Nathanael Spann1, Anyan Cheng4, Thomas Prohaska1, Babak Razani5, Robert Terkeltaub1, Benjamin Ebert6, Ru Liu Bryan7, Monica Guma8 and Christopher glass1, 1University of California San Diego, San Diego, CA, 2Department of Medicine, University of California San Diego, La Jolla, CA, 3Cedars-Sinai Medical Center, Los Angeles, CA, 4University of California San Diego, San Francisco, CA, 5Universit of Pittsburgh, Pittsburgh, PA, 6Dana-Farber Cancer Institute, Boston, MA, 7UCSD and VASDHS, San Diego, CA, 8San Diego VA Healthcare Service, La Jolla, CA
Background/Purpose: Gout is the most common form of inflammatory arthritis worldwide, which is characterised by the deposition of monosodium urate crystals (MSUc) in the joints that leads to lysosomal damage and triggers the activation of the inflammasome leading to acute episodes of inflammation. Clonal hematopoiesis of indeterminate potential (CHIP) is defined as a common, age-related disorder marked by the expansion of blood-cell clones by somatic mutations, mainly in DNMT3A or TET2. Interestingly, individuals with CHIP have a higher risk of developing gout. In line with this, activating similar inflammatory programs raises the question of what epigenetic molecular mechanisms underlying the association between gout and CHIP are.
Methods: We performed ATAC-Seq, ChIP-Seq, RNA-Seq, Western Blot, RT-qPCR, ChIP-qPCR, LysoTracker staining, in murine bone marrow-derived macrophages and human monocyte-derived macrophages stimulated with MSUc for 5h. Tfeb KO, Dnmt3a KO and Tfeb overexpressing macrophages (Tfeb-Tg) were used. AMPK activators Metformin or A766992 and DOT1L inhibitor SGC0946 (DOT1Li) were used.
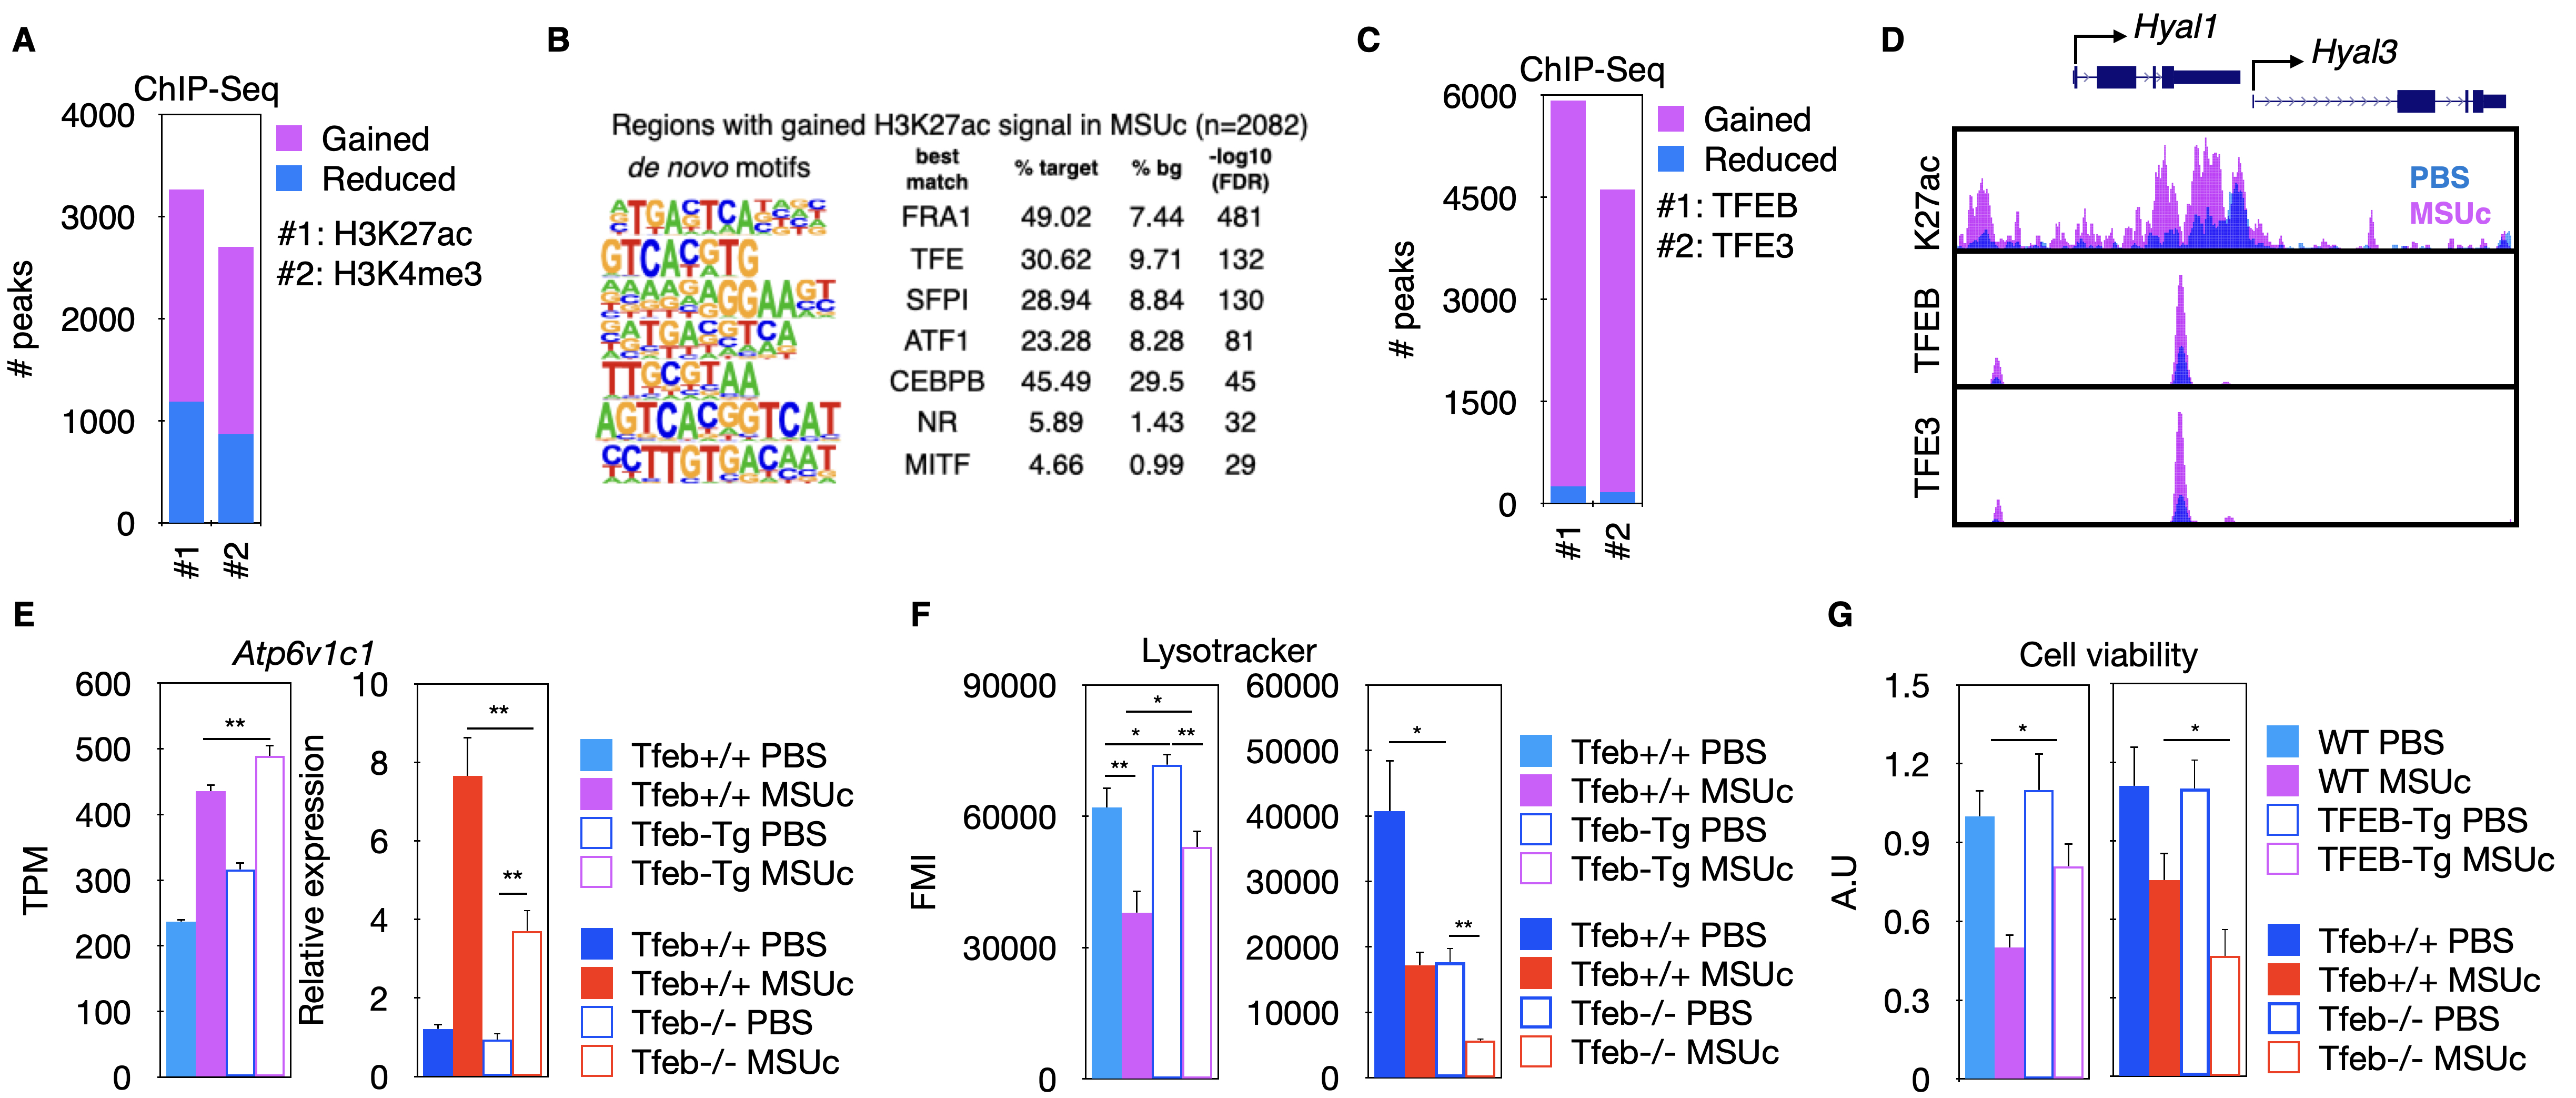
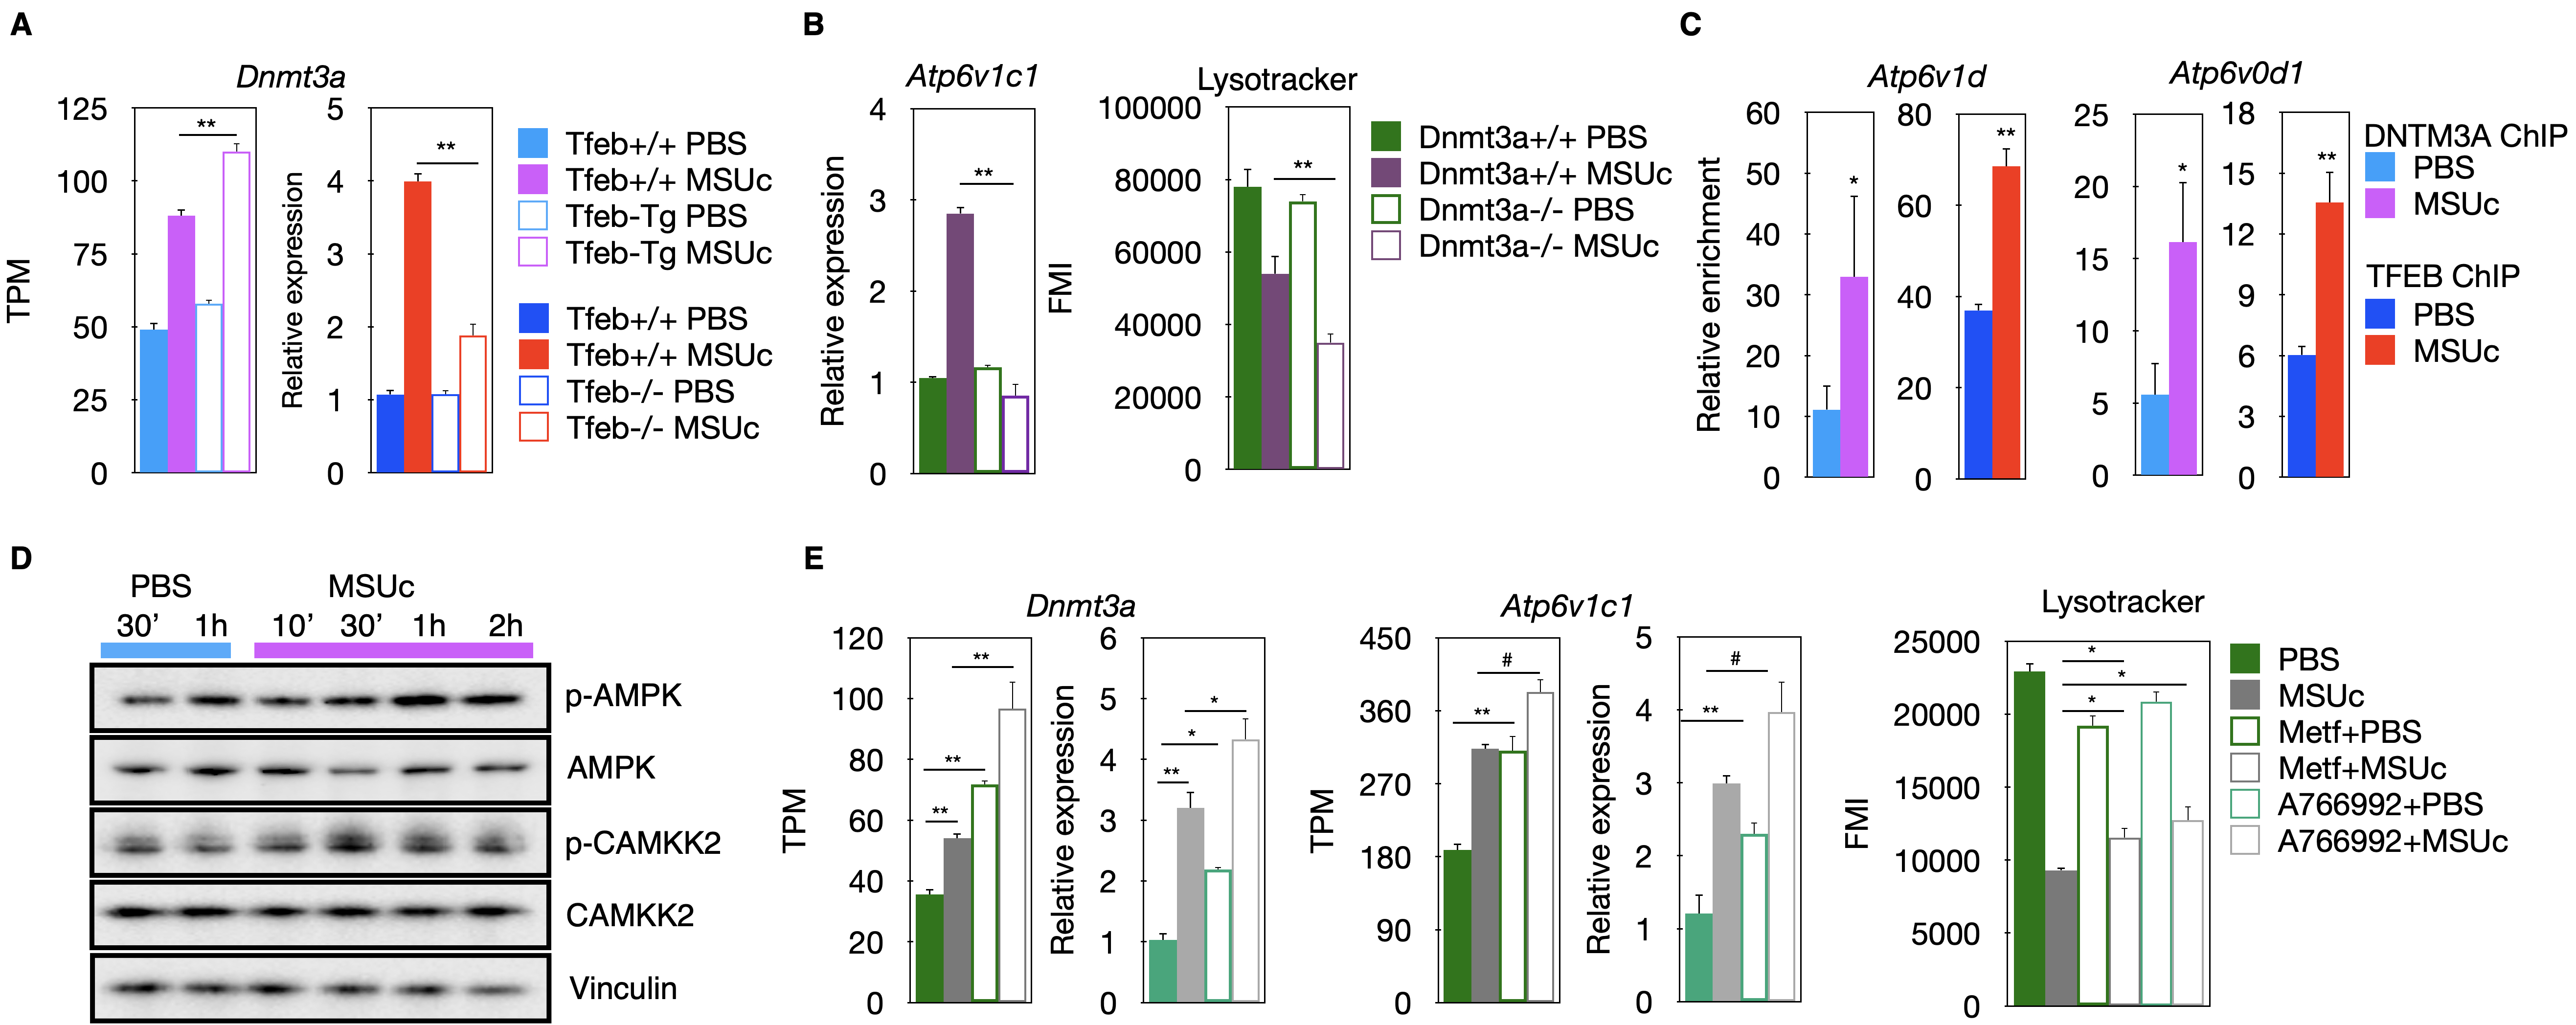
Results: We found over 2000 genomic regions with increased H3K27ac or H3K4me3 signal (Figure 1A). These genomic regions are enriched in binding sequences for MITF/TFE transcription factors (Figure 1B) which are master regulators of lysosomal biogenesis. Interestingly, we found that stimulation by MSUc leads to an increased binding of TFEB and TFE3 over 4000 genomic regions (Figure 1C) associated with the promoter of lysosomal genes Hyal1 and Hyal3 (Figure 1D). Moreover, whereas genetic overexpression of Tfeb (Tfeb-Tg) leads to increased expression of lysosomal genes including Atp6v1c1, higher LysoTracker staining and improved cell viability (Figure 1E-G, left panel), the opposite is observed for Tfeb knock-out macrophages (Figure 1E-G, right panel). In addition, we found that TFEB regulates Dnmt3a upregulation by MSUc (Figure 2A) and that Dnmt3a deletion leads to downregulation of lysosomal gene expression and LysoTracker staining (Figure 2B).
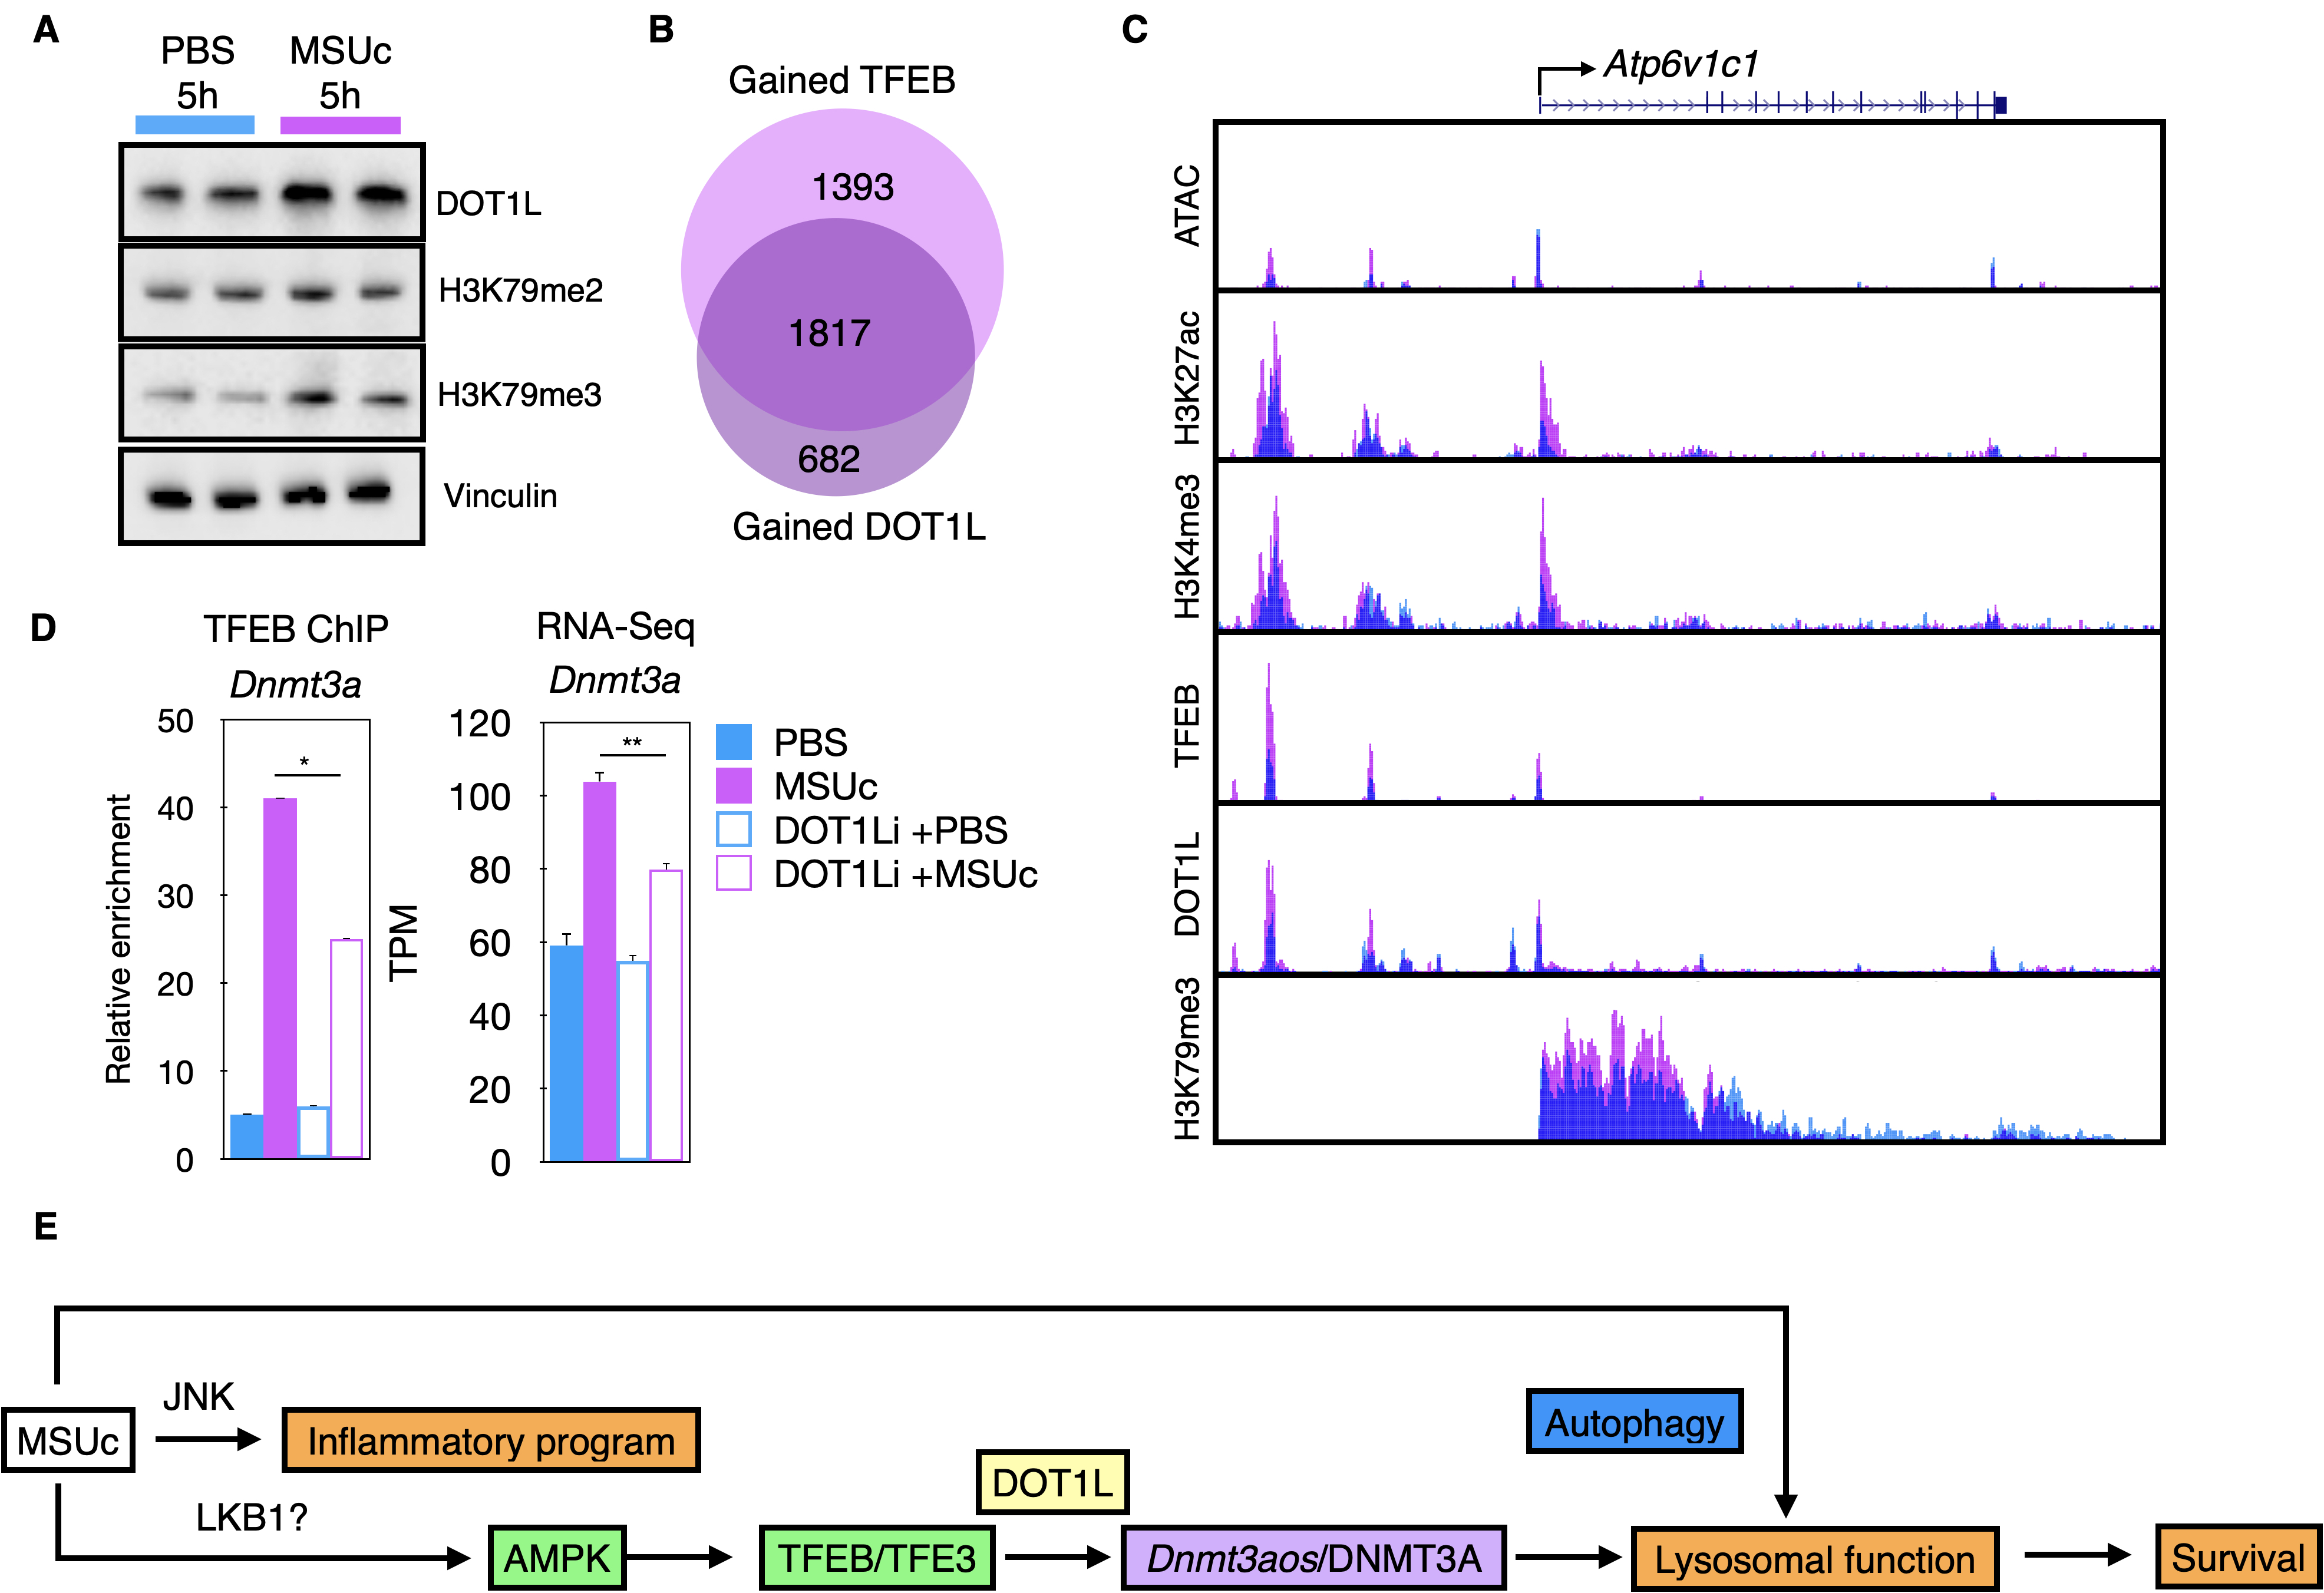
Moreover, we found that DNMT3A co-binds with TFEB over the promoter of Atp6v1d, and Atp6v0d1 (Figure 2C), indicating that TFEB and DNMT3A are part of the same genomic network. We also found that MSUc leads to activation of AMPK signaling (Figure 2D) and that treatment with AMPK activators Metformin or A766992 induces Dnmt3a and lysosomal gene expression and increases the LysoTracker staining by MSUc (Figure 2E). Furthermore, we found that the histone-methyl transferase DOT1L is upregulated by MSUc (Figure 3A) and co-bind with TFEB (Figure 3B) and DNMT3A over the promoter of lysosomal genes such as Atp6v1c1(Figure 3C). Treatment with DOT1L inhibitor reduces the recruitment of TFEB to the promoter of Dnmt3a, thereby, downregulating Dnmt3a expression (Figure 3D).
Conclusion: Our data indicate that DNMT3A cooperates with TFEB and DOT1L for the required regulation of lysosomal gene expression during gout flares by MSUc and provides a mechanistic explanation as to why patients with clonal hematopoiesis by DNMT3A mutations are at higher risk of developing more severe gout (Figure 3E). Our data opens novel therapeutic possibilities for patients with clonal hematopoiesis and gout.
Figure 1. MSUc leads to an altered histone landscape with increased TFEB, which is required to activate the lysosomal program during gouty inflammation. (A) ChIP-Seq of H3K27ac and H3K4me3 in macrophages by MSUc. (B) Motif analysis of regions with gained H3K27ac signal. (C) ChIP-Seq of TFEB and TFE3 after stimulation with MSUc. (D) UCSC Browser composite of H3K27ac (K27ac), TFEB and TFE3 ChIP-Seq. (E-G) Analysis of Atp6v1c1 expression (E), LysoTracker staining (F) or cell viability (G) of macrophages over-expressing Tfeb (Tfeb-Tg) or Tfeb KO. TPM=transcripts per million reads. FMI=fluorescence mean intensity. N>3/experiment. Except for RNA-Seq experiments, Student T-test was used to calculate statistical significance.
Figure 2. Upregulation of DNMT3A by TFEB through AMPK signaling is required to activate the lysosomal gene expression program by MSUc. (A) Expression analysis of Dnmt3a of macrophages over-expressing Tfeb (Tfeb-Tg) or Tfeb. (B) Expression of Atp6v1c1 (left) or LysoTracker staining (right) of wild type or Dnmt3a KO macrophages stimulated with MSUc. (C) Chromatin Immunoprecipitation of TFEB and DNTM3A over the promoter of Atp6v1d and Atp6v0d1. (D) Protein analysis by Western blot of AMPK signaling components. (E) Expression analysis of Dnmt3a (left), Atp6v1c1 (center) or LysoTracker staining (right) of macrophages incubated with Metformin (Metf) or A766992 prior to stimulation with MSUc. TPM=transcripts per million reads. FMI=fluorescence mean intensity. N>3/experiment. Except for RNA-Seq experiments, Student T-test was used to calculate statistical significance.
Figure 3. DOT1L is a TFEB binding partners that regulate Dnmt3a and lysosomal gene expression during gouty inflammation. (A) Protein analysis by Western blot for DOT1L and its downstream modified histone products. (B) Overlap between genes associated to increased TFEB and increased DOT1L signal by MSUc. (C) UCSC browser composite. (D) Chromatin immunoprecipitation of TFEB over the promoter of Dnmt3a (left) or Dnmt3a expression analysis (right) of macrophages incubated with DOT1L inhibitors prior to stimulation with MSUc. (E) Schematic summary of the response of macrophages to MSUc . TPM=transcripts per million reads. FMI=fluorescence mean intensity. N>3/experiment. Except for RNA-Seq experiments, Student T-test was used to calculate statistical significance.
I. Cobo: None; J. Murillo-Saich: None; M. Alishala: None; S. Calderon: None; R. Coras: None; N. Spann: None; A. Cheng: None; T. Prohaska: ; B. Razani: None; R. Terkeltaub: atom biosciences, 2, dyve, 2, fortress, 2, generate biosciencez, 2; B. Ebert: Calico, 5, Exo Therapeutics, 1, 8, Neomorph, 12, Founder, SAB member, stockholder, Novartis, 5, Skyhawk Therapeutics, 1, 8, TenSixteen Bio, 12, Founder, SAB member, stockholder; R. Liu Bryan: None; M. Guma: Genentech, 5, Gilead, 5, Novartis, 5, Pfizer, 5; C. glass: None.