1588: Monocyte-derived Macrophages Accumulate in the Lungs in anti-MDA5+ Dermatomyositis with RP-ILD: Proinflammatory and Profibrotic Phenotype Revealed by Single-cell RNA Sequencing
Peking Union Medical College Beijing, Beijing, China
Disclosure information not submitted.
Xiaoya Pei1, Jia Shi2, Yangzhong Zhou2, Xiao Zhang2, Xiaoman Wang1, Mingwei Tang2, Shuang Zhou2, chanyuan wu2, Jinmin Peng3, Mengtao Li4, xiaofeng Zeng2, Jun Liu5, Houzao Chen1 and Qian Wang2, 1State Key Laboratory of Medical Molecular Biology, Department of Biochemistry and Molecular Biology, Institute of Basic Medical Sciences, Chinese Academy of Medical Sciences and Peking Union Medical College, Beijing, China, 2Department of Rheumatology, Peking Union Medical College Hospital, Chinese Academy of Medical Sciences & Peking Union Medical College, Beijing, China, 3Medical Intensive Care Unit, State Key Laboratory of Complex Severe and Rare Diseases, Peking Union Medical College Hospital, Peking Union Medical College and Chinese Academy of Medical Sciences, Beijing, China, 4Peking Union Medical College Hospital, Chinese Academy of Medical Sciences & Peking Union Medical College, Beijing, China, 5State Key Laboratory of Protein and Plant Gene Research, School of Life Sciences, Peking-Tsinghua Center for Life Sciences, Peking University, Beijing, China
Background/Purpose: Anti-melanoma differentiation-associated gene 5-positive dermatomyositis (anti-MDA5+ DM) is a rare inflammatory autoimmune disease with impressively life-threatening rapid progressive interstitial lung disease (RP-ILD). The mechanism that leads to immune dysfunction and lung injury remains elusive.
Methods: We applied single-cell RNA sequencing to the peripheral blood mononuclear cells (PBMCs) from three anti-MDA5+ DM patients and cells in paired broncho-alveolar lavage fluid (BALF). The datasets of healthy controls are from GSE158055 (PBMC) and GSE14592 (BALF). Flow cytometry and Luminex assay were further applied to validate the results.
Results: A high-quality scRNA-seq dataset composed of 64,565 cells were generated from three anti-MDA5+ DM patients, revealing profound aberrations of various immune compartments and distinct immune responses both in peripheral blood and lungs. We found increased monocytes resembling myeloid-derived suppressor cells (MDSCs), which correlated with inflammatory markers in the blood ofanti-MDA5+ DM patients. While those MDSC-like monocytes showed enhanced activation of type I interferon signaling pathway, they were immune-paralyzed, with downregulation of cytokines and inflammatory gene expressions. In contrast, the lung microenvironmentofanti-MDA5+ DM exhibited overactivation of immune responses, with monocyte-macrophages in BALFs producing massive amounts of cytokines and chemokines. To be more specific, monocyte-derived alveolar macrophages (Mo-AMs) might be the major source triggering the cytokine storm in the lung, with cell ratios and inflammatory expression both significantly elevated inanti-MDA5+ DM patients. The prominent expression of chemokines of Mo-AMs suggested a feed forward loop of immune cell recruitment and inflammatory cascade. Besides, pseudo-time trajectory analysis revealed that recruited Mo-AMs adopt a fibrosis-associated phenotype during the process of differentiation.
Conclusion: Our study comprehensively depicts the dysregulated peripheral and lung immune landscape inanti-MDA5+ DM, and highlights the proinflammatory and profibrotic role of Mo-AMs in the pathogenesis and progression ofanti-MDA5+ DM with RP-ILD, implying that targeting Mo-AMs or blockade of monocyte influx to lung may present an effective strategy.
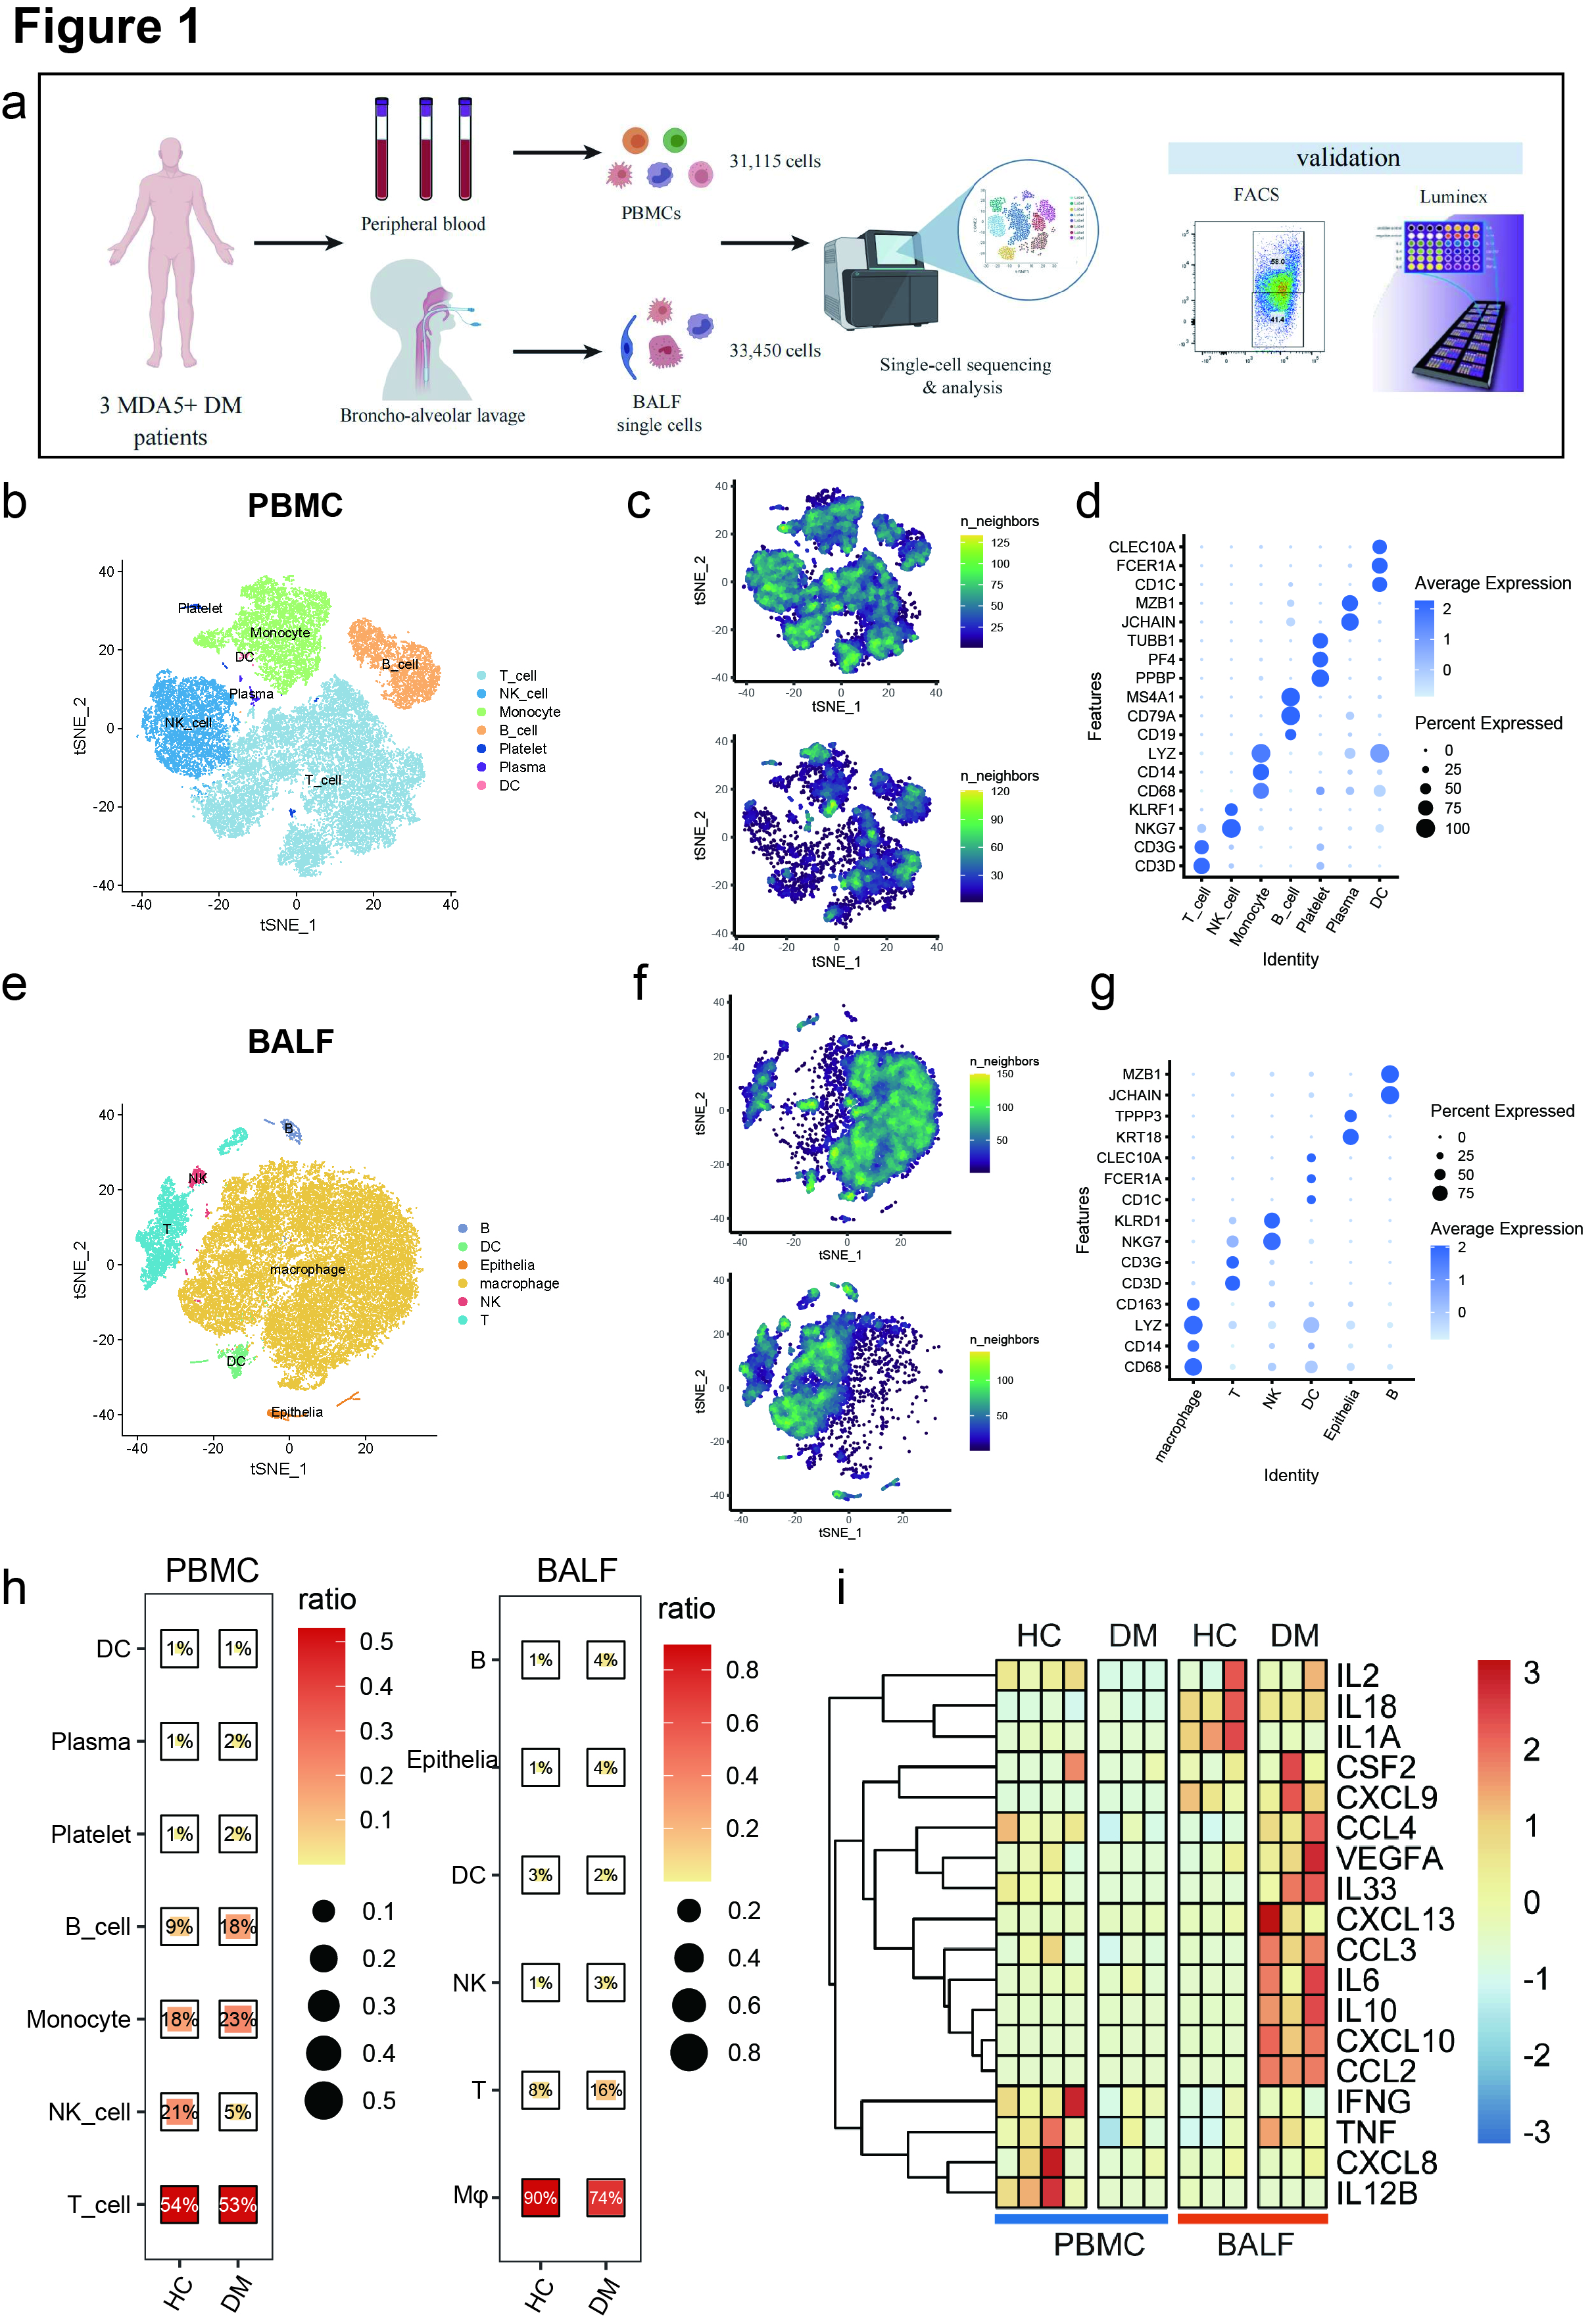
Figure 1. (a) Flowchart depicting the overall experimental design of this study. (b&e) t-SNE plot showing the overview of cell clusters in the integrated single-cell transcriptomes of PBMCs and BALFs from anti-MDA5+ DM patients and healthy controls (HCs). (c&f) t-SNE plots showing the single-cell transcriptomes of PBMCs and BALFs from HCs (top) and anti-MDA5+ DM patients (bottom) respectively. (d&g)The specific markers for identifying each immune cell types in b&e are indicated. (h)The ratios of each cell cluster in PBMCs and BALFs from anti-MDA5+ DM patients and HCs. (i) Heatmap showing the expressions of key cytokines and chemokines involved in cytokine strom of PBMCs and BALFs from HCs and patients.
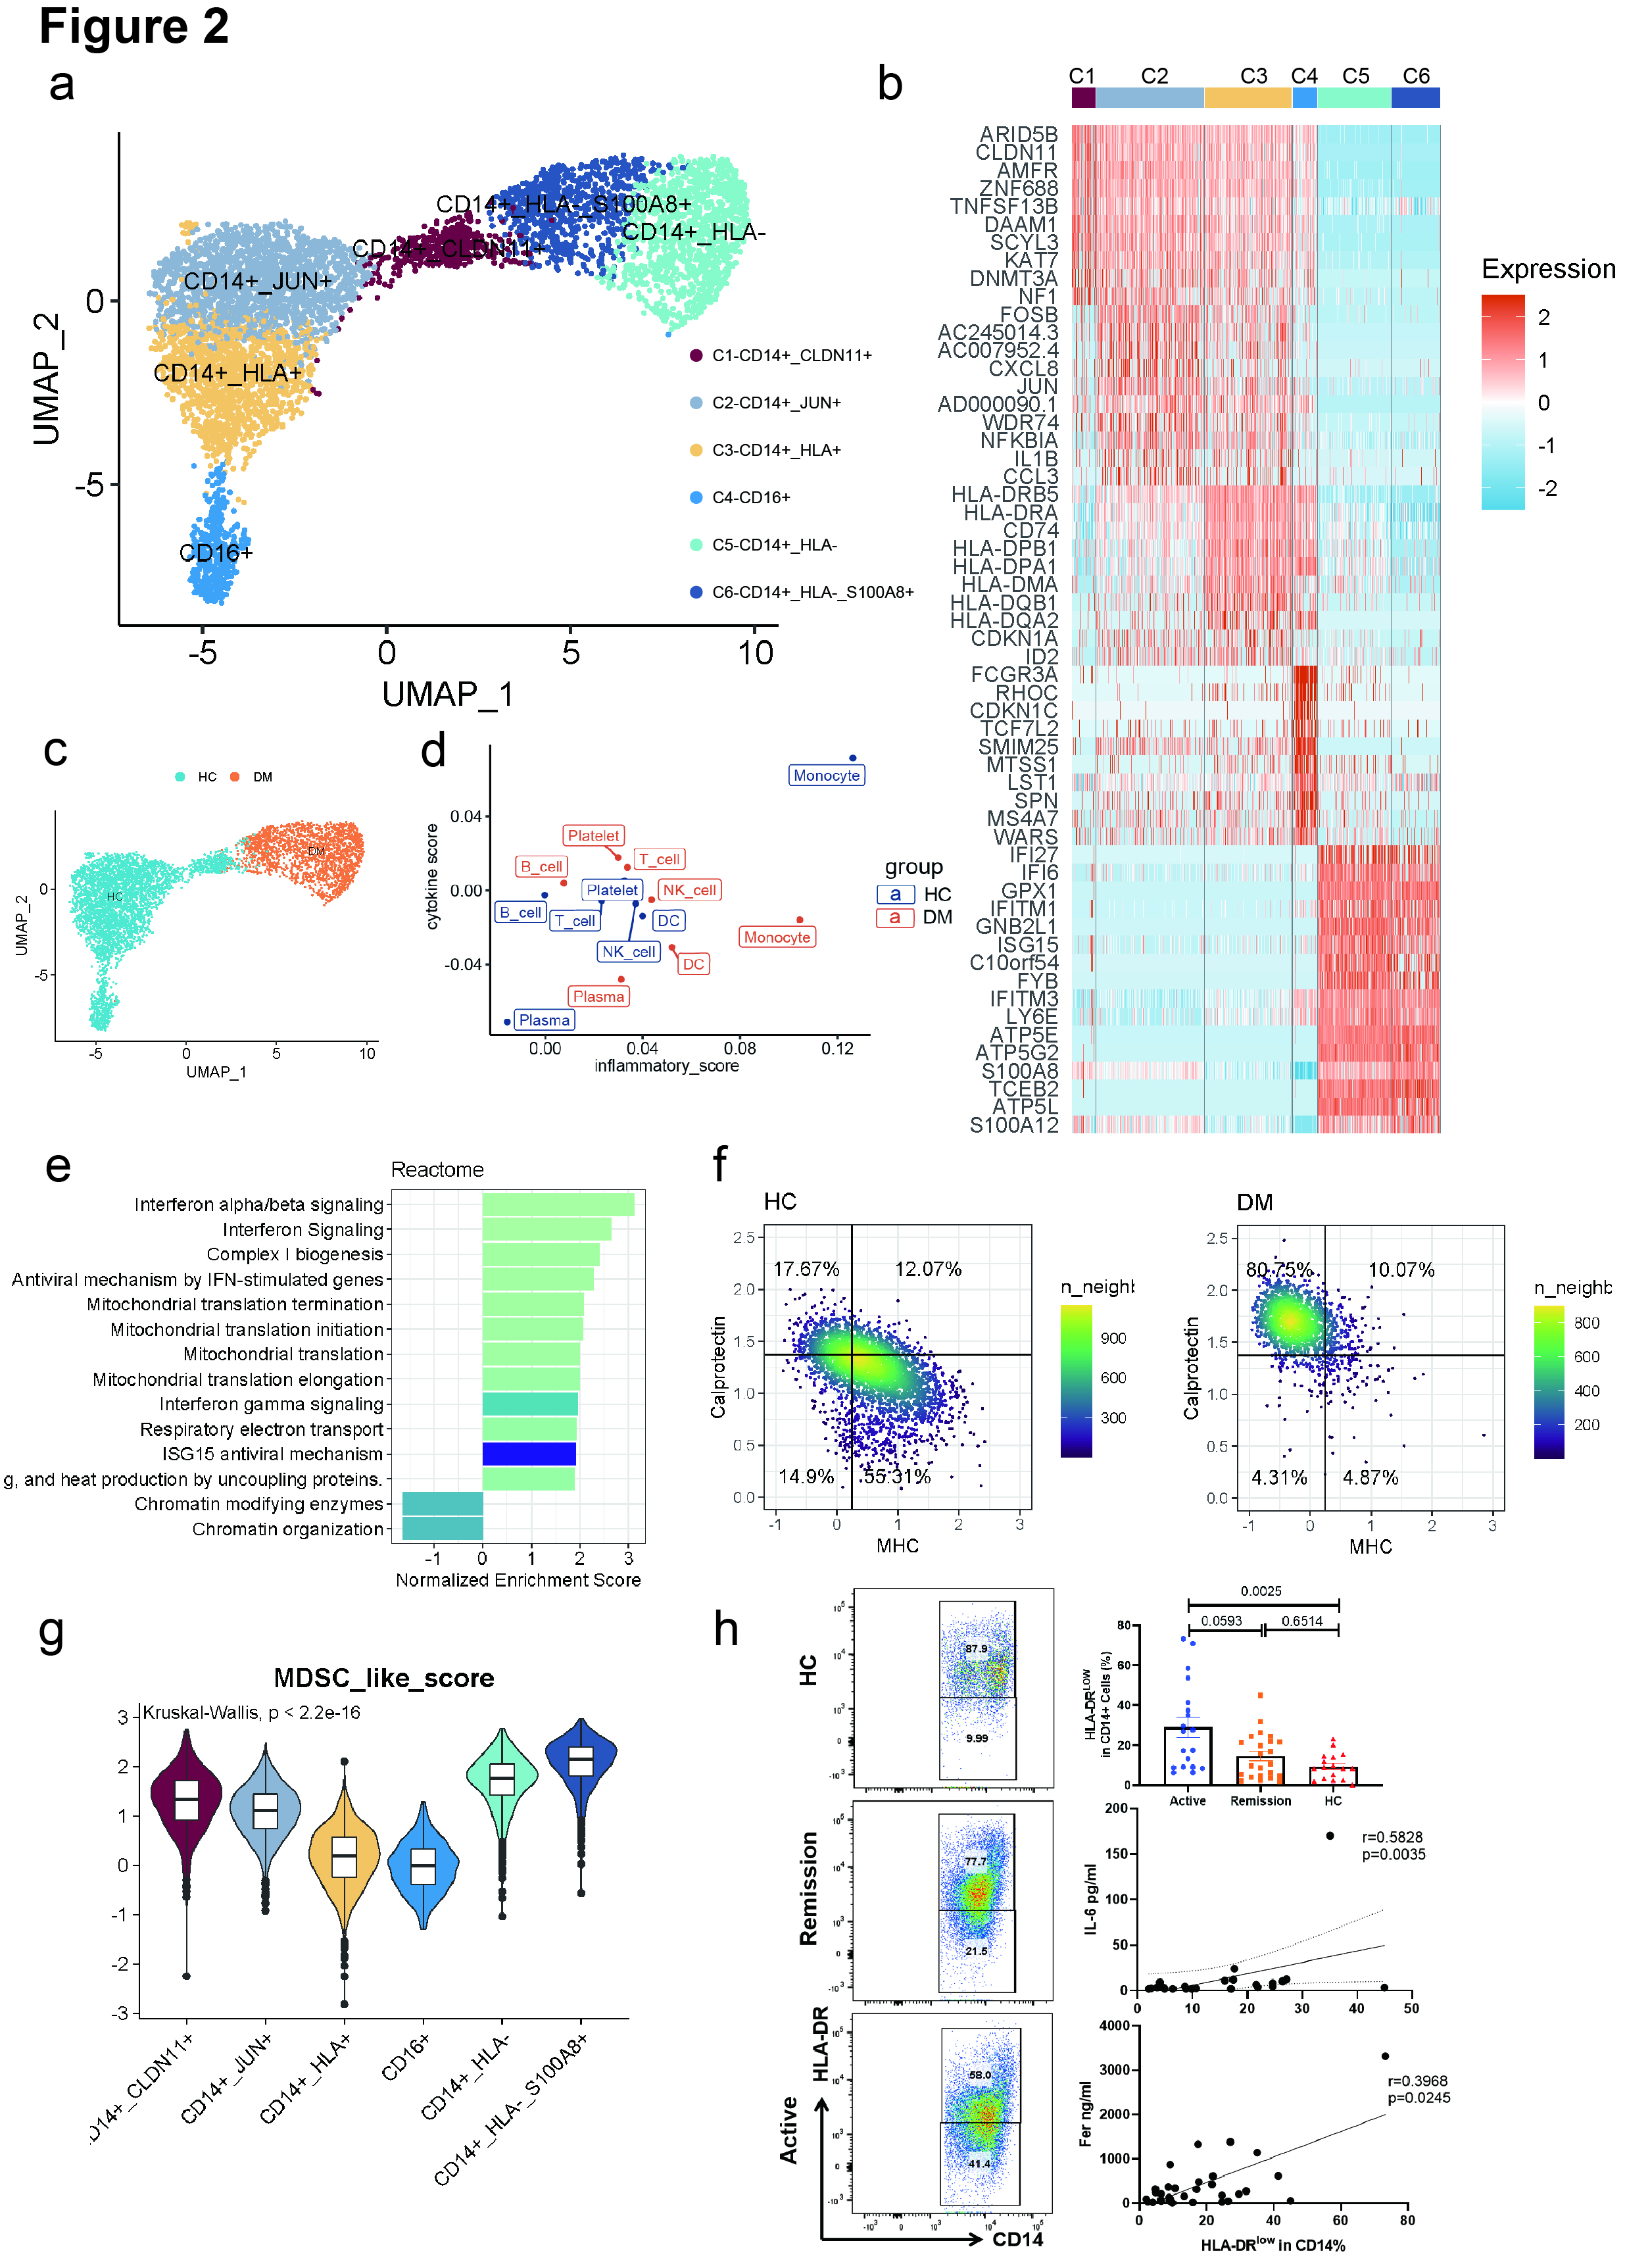
Figure 2. (a) UMAP plot of six cell clusters of monocytes in PBMCs. (b) Heatmap showing top 10 marker genes for each cluster. (c) UMAP plot showing monocytes across HCs and patients. (d) Inflammatory scores and cytokine scores of PBMC cell clusters. (e) Bar plot showing the pathways enriched in the anti-MDA5+ DM group across monocytes. (f) Density plots show the composite MHC II signature scores and calprotectin signature scores of peripheral CD14+ monocytes in 2D maps. The horizontal and vertical lines separating the four quadrants represent the median scores of all CD14+ monocytes. The percentages of cells in each quadrant are indicated. (g) Violin plot showing the MDSC-like score of each monocyte cluster. (h) Left panel shows the representative flow cytometric data of HLA-DR expression on CD14+ PBMCs. Right top plot shows the percentage of HLA-DRLow cells in CD14+ PBMCs among anti-MDA5+ DM-active group, anti-MDA5+ DM-remission group and HC group. The middle and bottom plot on the right shows the Spearman correlation of HLA-DRLow% and IL-6, and ferritin levels.
Figure 3. (a) UMAP plot of nine cell clusters of monocyte-macrophage in BALFs. (b) Heatmap showing top 10 marker genes for each cluster. (c) UMAP plot showing monocyte-macrophages across HCs and anti-MDA5+ DM patients. Bar plot showing the proportions of each monocyte-macrophage cluster in BALFs from individual subjects. (d) Pseudotime trajectory analysis of monocyte-macrophages in anti-MDA5+ DM patients. (e) Violin plots showing the cytokine scores and inflammatory scores of each monocyte-macrophage cluster. (f) Gene set module score of ‘IPF-expanded macrophages’ (IPFe-Mp) and alveolar FABP4+Mp (Ayaub et al., 2021), calculated based on single transcriptomes. Projected onto the UMAP embedding (top) and plotted as violin plots (bottom) across the monocyte-macrophage clusters. Dot color indicates signature module score. Violin colors show cluster identity.
X. Pei: None; J. Shi: None; Y. Zhou: None; X. Zhang: None; X. Wang: None; M. Tang: None; S. Zhou: None; c. wu: None; J. Peng: None; M. Li: None; x. Zeng: None; J. Liu: None; H. Chen: None; Q. Wang: None.


.jpg)
