Lien Moreel1, Walter Coudyzer2, Lennert Boeckxstaens3, Albrecht Betrains1, Geert Molenberghs4, Steven Vanderschueren1, Eveline Claus2, Koen Van Laere5 and Daniel Blockmans1, 1Department of General Internal Medicine, University Hospitals Leuven, Department of Microbiology, Immunology, and Transplantation, KU Leuven, Leuven, Belgium, 2Department of Radiology, University Hospitals Leuven, Leuven, Belgium, 3Department of Nuclear Medicine, University Hospitals Leuven, Leuven, Belgium, 4Interuniversity Institute for Biostatistics and Statistical Bioinformatics (I-BioStat), University of Leuven and Hasselt University, Leuven, Belgium, 5Department of Nuclear Medicine, University Hospitals Leuven,Department of Imaging and Pathology, Nuclear Medicine and Molecular Imaging, KU Leuven, Leuven, Belgium
Background/Purpose: Patients with giant cell arteritis (GCA) have an increased risk of developing thoracic aortic aneurysms. Retrospective studies have shown that 18F-fluorodeoxyglucose (FDG) uptake in large vessels at diagnosis increases the risk of developing aortic complications during follow-up. The aim of this study was to prospectively evaluate the association between FDG uptake in large vessels at diagnosis and the evolution of aortic diameter and volume in GCA patients.
Methods: GCA patients who have had FDG positron emission tomography (PET) imaging at diagnosis ≤3 days after initiation of glucocorticoids and who were prospectively followed for ≥2 years were included. PET scans were semi quantitatively scored (0-3) at 7 vascular areas and a total vascular score (TVS) was calculated, ranging from 0 to 21. PET scans were considered positive in case of FDG uptake ≥ grade 2 in any large vessel. Patients underwent computed tomography (CT) imaging at diagnosis and yearly thereafter for a maximum of 10 years. The association between vascular FDG uptake and aortic dimensions was estimated by linear mixed effect models with random intercept and slope in time adjusted for age, sex, AORTA score, CT or PET/CT scan and intravenous contrast. The ascending aorta, aortic arch, and descending aorta were considered aneurysmatic when the diameter was ≥45, ≥40, and ≥35 mm, respectively.
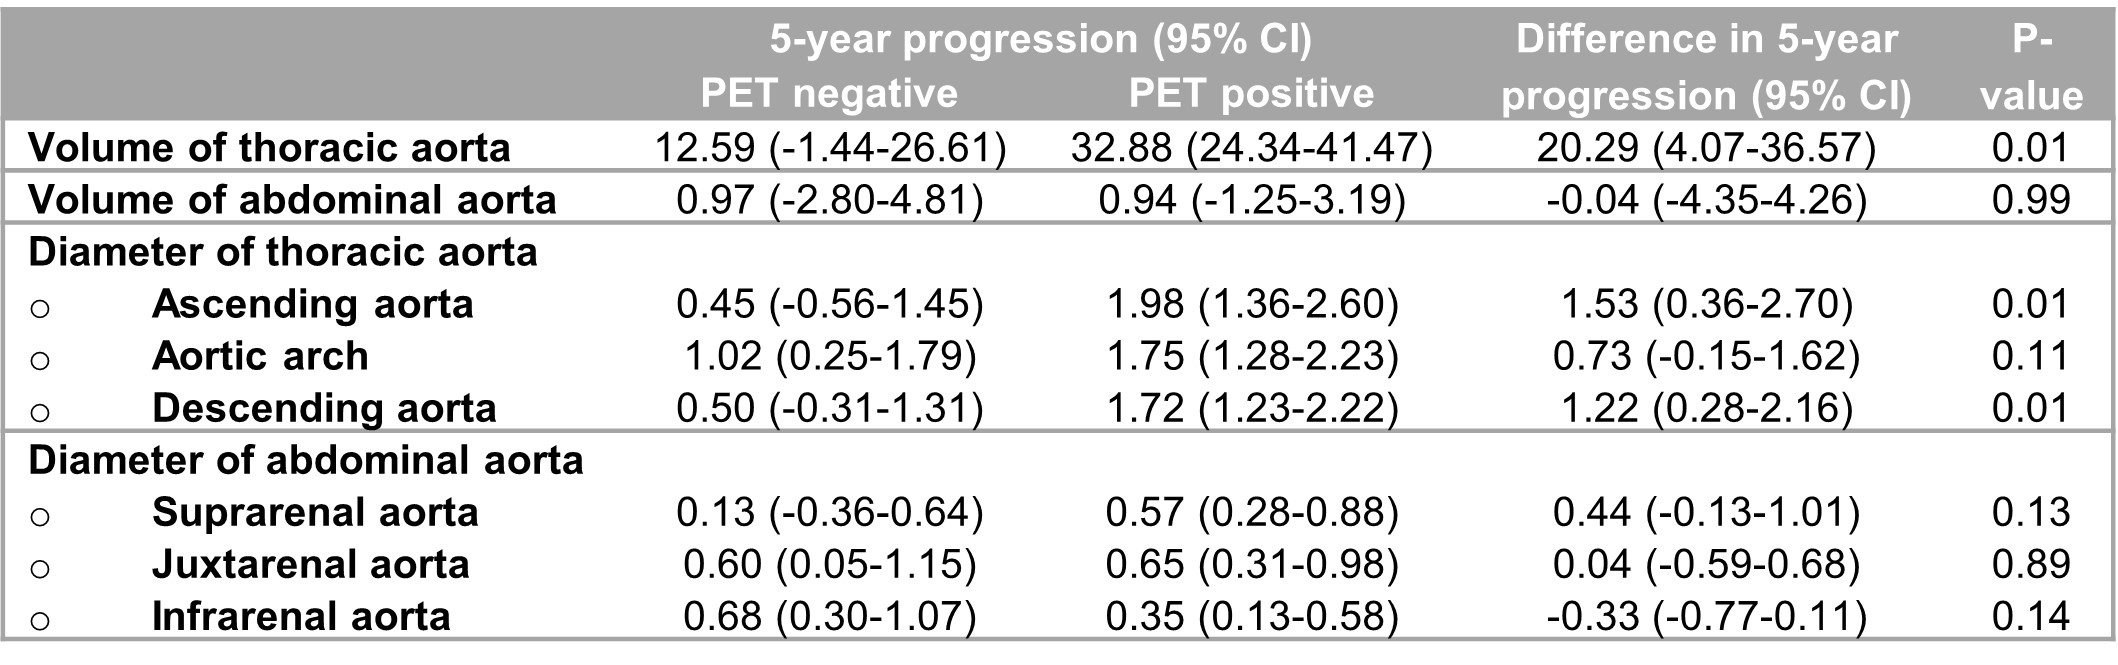
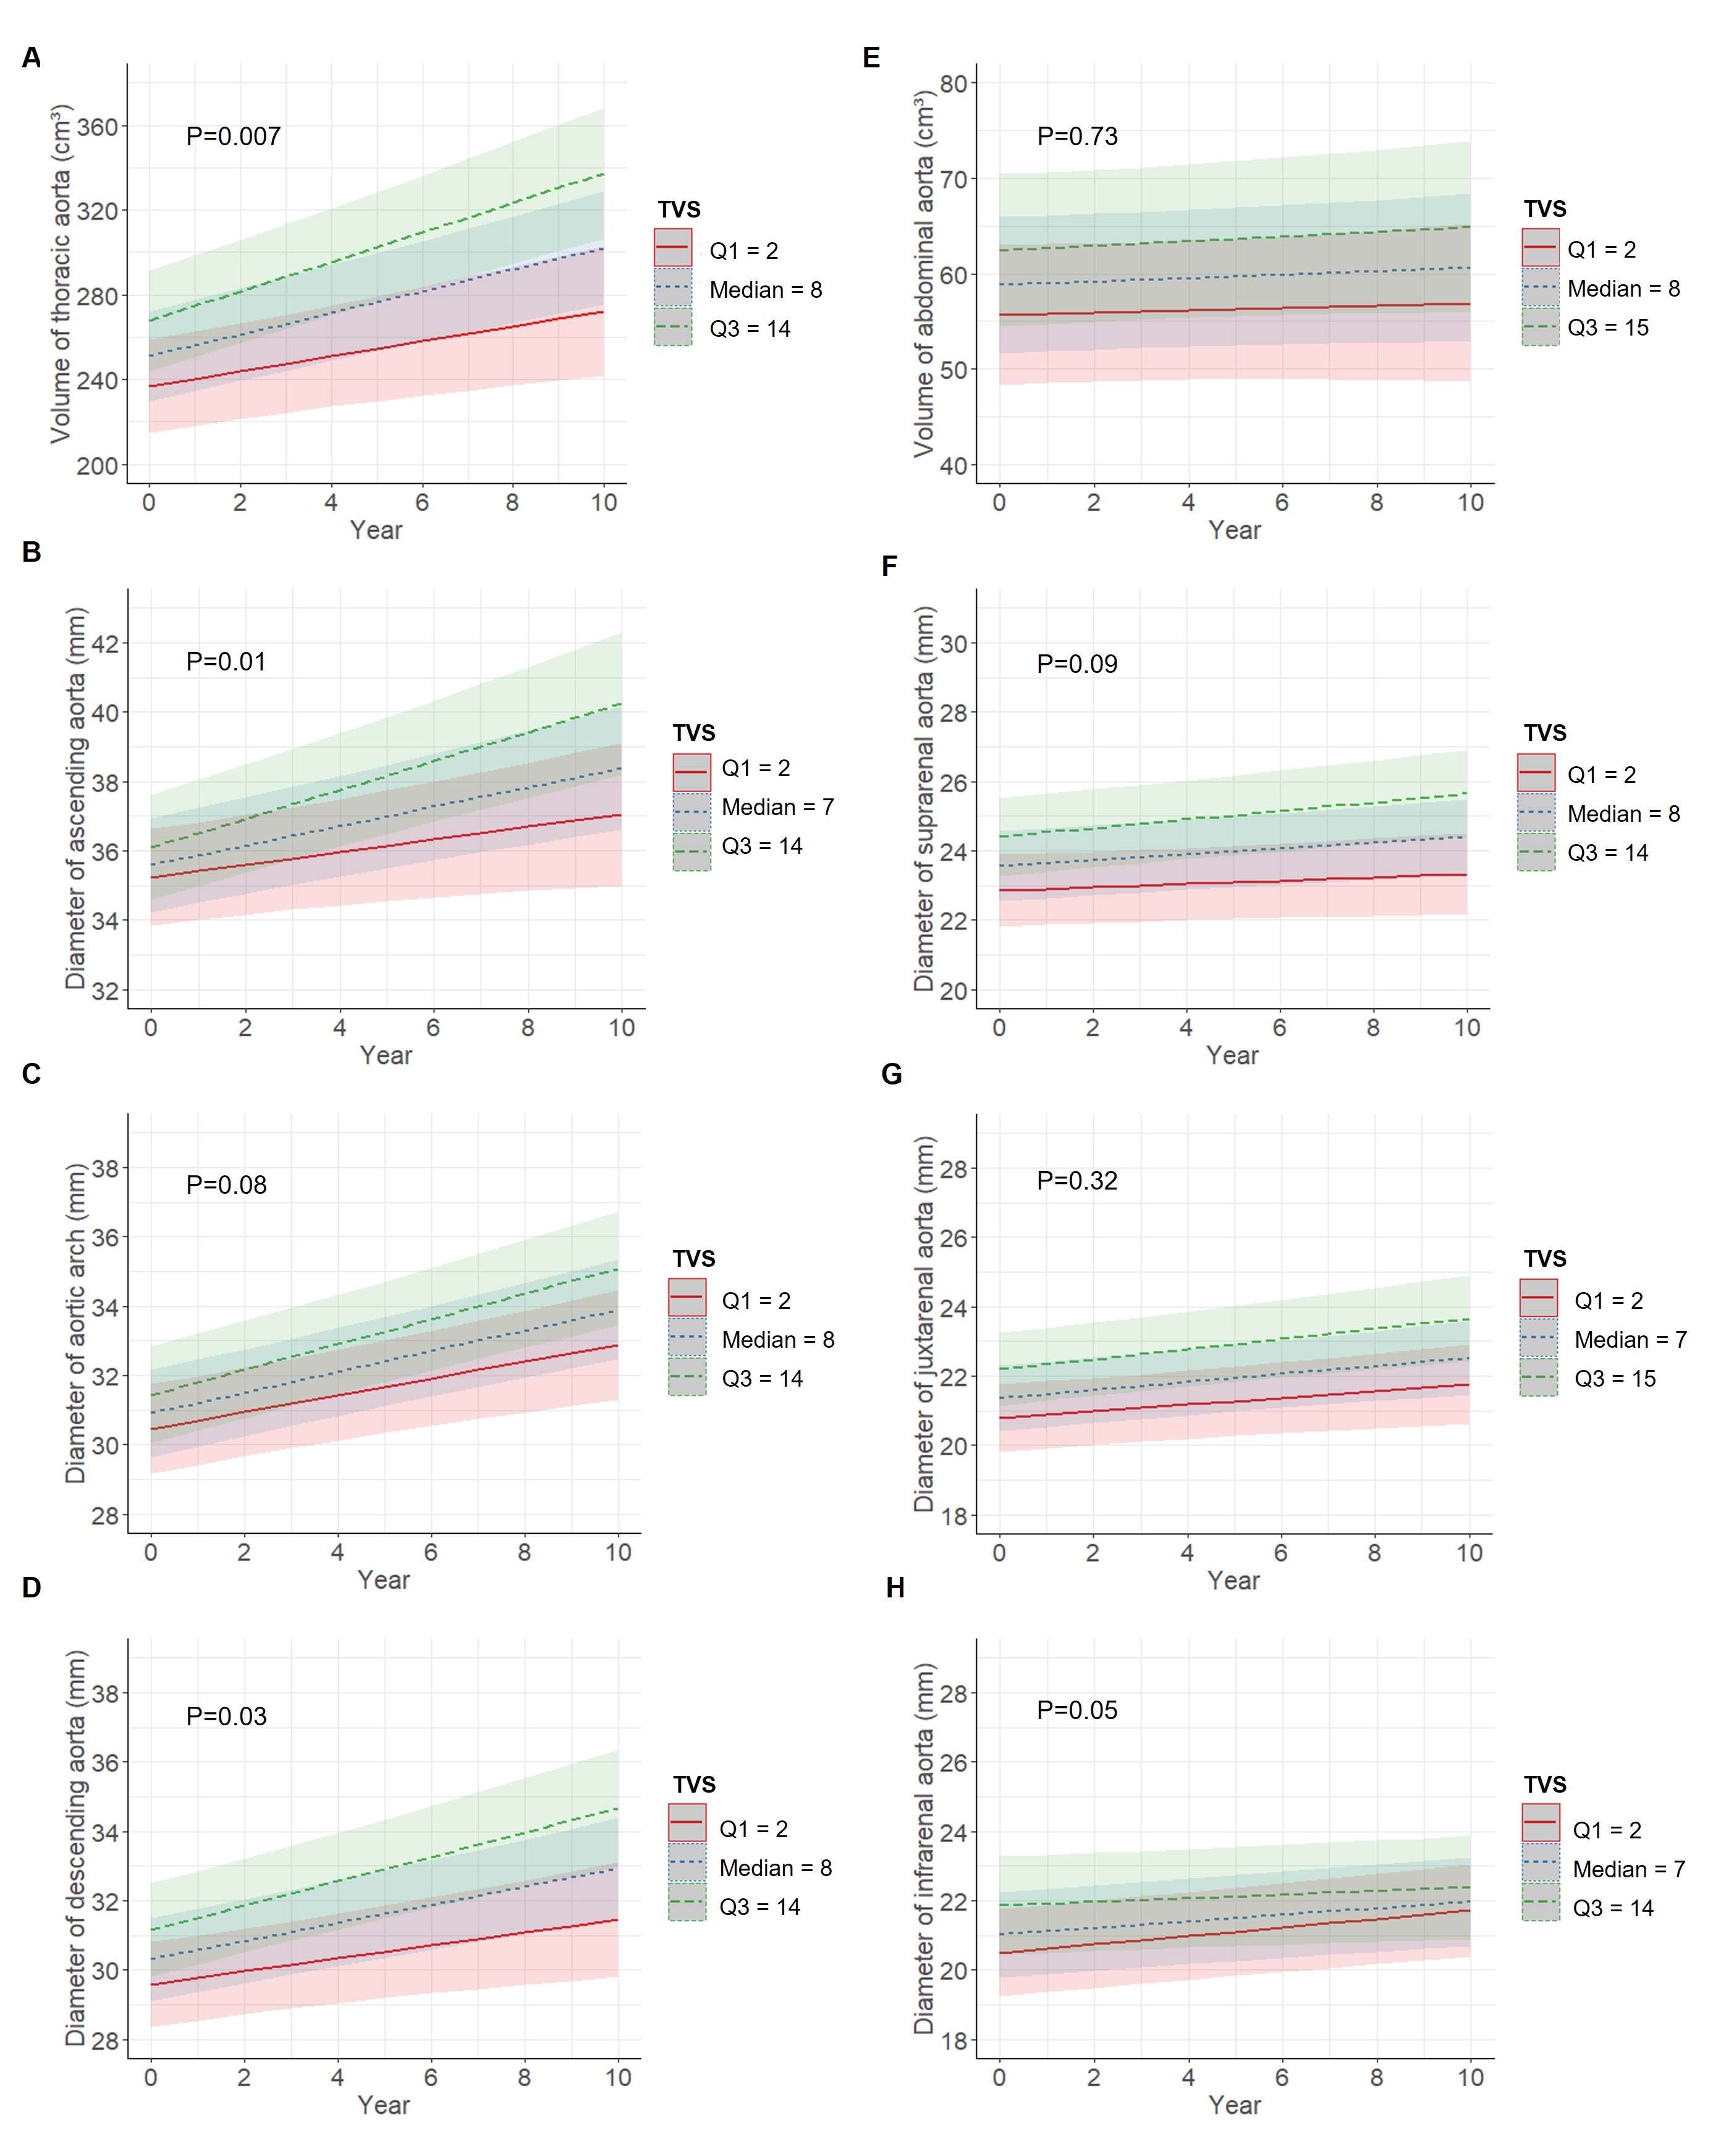
Results: Hundred patients (mean age 70 years, 68% females) were included, of which 74 (74%) had FDG uptake ≥ grade 2 in any large vessel. The 2022 ACR/EULAR GCA criteria were fulfilled in 89 (89%) patients. Median follow-up was 80 months (IQR 47-110). The increase in ascending and descending aortic diameter and in thoracic aortic volume was higher in patients with a positive PET scan compared to those without (difference in 5-year progression 1.53 mm [95%CI 0.36-2.70 mm], 1.22 mm [95%CI 0.28-2.16 mm] and 20.29 cm³ [95%CI 4.07-36.57 cm³], respectively) (Table 1). These thoracic aortic dimensions were also significantly associated with TVS (Figure 1). FDG uptake was not associated with an increase in abdominal aortic diameters nor volume. Patients with a positive PET scan had a higher risk of developing thoracic aortic aneurysms (aHR 13.61, 95%CI 1.63-113.50) with a median time since diagnosis of 40 months (IQR 18-61). Thoracic aortic aneurysm developed in 13 of the 15 (87%) patients in a region with elevated FDG uptake at diagnosis. Two patients with high TVS (15 and 16) needed surgery for ascending aortic aneurysm.
Conclusion: Higher TVS was associated with greater yearly increase in thoracic aortic dimensions. Vascular FDG uptake at diagnosis was an independent risk factor for developing thoracic aortic aneurysm in GCA patients. Performing PET imaging at diagnosis may help to estimate the future risk of aortic aneurysm formation. Follow-up of aortic dimensions may be warranted in patients with thoracic aortic FDG uptake or high TVS.
Table 1: Evolution of the aortic diameters (in mm) and volumes (in cm³) in 5 years in patients with (PET positive) and without (PET negative) FDG uptake ≥ grade 2 in any large vessel. The linear mixed models were adjusted for age, sex, AORTA score, CT or PET/CT scan, and intravenous contrast. Abbreviations: 95% CI, 95% confidence interval; CT, computed tomography; FDG, fluorodeoxyglucose; PET, positron emission tomography
Figure 1: Linear mixed model analysis of the association between the total vascular score and the evolution in aortic dimensions. The x-axis represents the time (in years) since the diagnosis. The y-axis represents the size of the aorta: A. volume of thoracic aorta (in cm³), B. diameter of ascending aorta (in mm), C. diameter of aortic arch (in mm), D. diameter of descending aorta (in mm), E. volume of abdominal aorta (in cm³), F. diameter of suprarenal aorta (in mm), G. diameter of juxtarenal aorta (in mm), and H. diameter of infrarenal aorta (in mm). The lines and bands represent the mean trajectory and 95% confidence interval of each subgroup. The red solid line represents the first quartile of the total vascular score, the blue dotted line the median and the green dashed line the third quartile. The linear mixed models were adjusted for age, sex, AORTA score, CT or PET/CT scan, and intravenous contrast. Abbreviations: CT, computed tomography; PET, positron emission tomography; TVS, total vascular score
L. Moreel: None; W. Coudyzer: None; L. Boeckxstaens: None; A. Betrains: None; G. Molenberghs: None; S. Vanderschueren: None; E. Claus: None; K. Van Laere: None; D. Blockmans: None.