Session: Abstracts: Health Services Research I (0805–0810)
0807: Inferring Disease Activity Scores and Low Disease Activity at Registry Visits Based on Structured and Narrative Data from Electronic Health Records
Massachusetts General Hospital Boston, MA, United States
Disclosure information not submitted.
David Cheng1, Dana Weisenfeld2, Kumar Dahal2, Qing Liu2, Vidul Ayakulangara Panickan3, Mary Jeffway2, Thany Seyok2, Gregory McDermott2, Michael Weinblatt4, Nancy Shadick5, Tianxi Cai6 and Katherine Liao2, 1Massachusetts General Hospital, Boston, MA, 2Brigham and Women's Hospital, Boston, MA, 3Harvard Medical School, Boston, MA, 4Harvard Medical School, Waban, MA, 5Brigham and Women's Hospital, Boston, MA, 6Harvard T.H. Chan School of Public Health, Boston, MA
Background/Purpose: Real-world data including electronic health records (EHRs) are a promising resource for learning to optimize treatment strategies for rheumatoid arthritis (RA). A major challenge in leveraging real-world data in rheumatology is the lack of standardized collection of disease activity measures. Previous studies had limited success inferring disease activity with administrative claims and EHR data. This study aimed to assess the accuracy of inferring disease activity as measured by the Disease Activity Score in 28 joints with CRP (DAS28-CRP) using both structured and narrative EHR data extracted from notes with natural language processing (NLP).
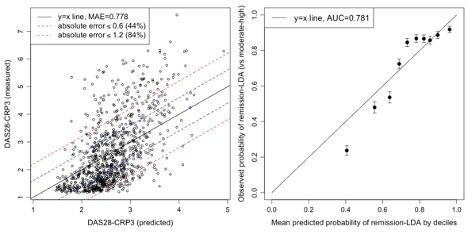
Methods: We studied RA patients from a single center registry linked with EHR data. The structured data included RA-related diagnosis and procedure codes, medication prescriptions, and laboratory test encounters and values. The NLP data included mentions of RA and disease activity concepts. Models were trained on DAS28-CRP obtained during in-person study visits from the registry. For each visit, structured and NLP data were extracted from EHR encounters within 24 weeks. In 80% of the visits, we fit separate random forest models to predict the continuous DAS28-CRP value and the binary disease activity status categorized into remission/low (LDA; DAS28≤3.2) vs moderate/high disease activity (DAS28 >3.2). We validated the predictions in the remaining 20%. To assess the accuracy of predicting DAS28-CRP values, we estimated the mean absolute error (MAE; lower values indicate lower error), percentage of predictions within 0.6 (reported measurement error for DAS28-CRP), and 1.2 (minimal clinically important difference (MCID)) of the observed values. For LDA status, we calculated the area under the curve (AUC). Observed values and probabilities were plotted against predicted values and mean predicted probabilities in deciles to further assess prediction performance. We identified influential EHR features for predictions using Gini impurity. These analyses were repeated with and without including NLP data. We benchmarked against manual chart-review for inferring LDA, using LDA defined by DAS28-CRP as reference, in a sample of 67 visits.
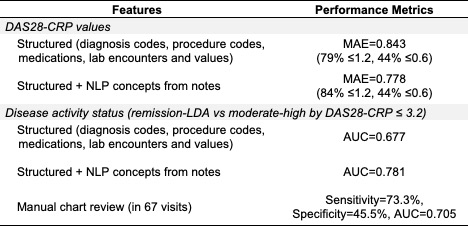
Results: We identified 4,883 visits among 1,059 patients with a DAS28-CRP score. The mean age at first visit was 60.5 years old, with 83.6% of patients being female and 89.4% White. The MAE for DAS28-CRP values was 0.778, with 84% and 44% of absolute errors within 1.2 (MCID) and 0.6 (measurement error). The AUC for LDA was 0.781 (Figure 1). Incorporating NLP data consistently improved prediction performance (Table 1). Features with the highest importance included CRP and ESR values, age, receiving a CRP test, and NLP mentions of disease activity and glucocorticoids. The model incorporating NLP data achieved a higher AUC over manual chart review.
Conclusion: Inferring disease activity with EHR data collected from routine care, particularly with the addition of data from narrative notes, achieved moderate accuracy against prospectively collected DAS28-CRP measures. Further work is needed to validate whether these inferred disease activity measures can be applied to reliably assess response to treatment in observational data.
Observed vs. predicted DAS28-CRP values among the validation set based on structured + NLP features (left). Calibration plot (right) shows observed probability of LDA and corresponding 95% confidence intervals vs. mean predicted probability of LDA by deciles of predicted probability based on structured + NLP features.
Performance of phenotyping models with and without RA-related NLP concepts from notes and relative to manual chart review. MAE: mean absolute error, AUC: area under the curve, NLP: natural language processing.
D. Cheng: None; D. Weisenfeld: None; K. Dahal: None; Q. Liu: None; V. Ayakulangara Panickan: None; M. Jeffway: None; T. Seyok: None; G. McDermott: None; M. Weinblatt: Abbvie, 2, 5, Aclaris, 2, Amgen, 2, Aqtual, 5, Bristol Myers Squibb, 2, 5, Canfite, 11, Corevitas, 2, CorEvitas, 2, Eli Lilly, 2, Gilead, 2, 2, Glaxo Smith Kline, 2, Horizon, 2, Inmedix, 11, Janssen, 5, Johnson and Johnson, 2, Pfizer, 2, Prometheus Laboratories, 2, Rani, 2, Revolo, 2, Sanofi, 2, Sci Rhom, 2, Scipher, 2, 11, Set Point, 2, UCB, 2; N. Shadick: Abbvie, 5, AQtual, 5, Bristol-Myers Squibb(BMS), 5, Janssen, 5; T. Cai: None; K. Liao: UCB, 2.