Abstract Session
Epidemiology, health policy and outcomes
Session: Abstracts: Measures & Measurement of Healthcare Quality (0751–0756)
0756: Validation of Quantitative Effusion-synovitis Volume Measured by Deep-learning: Data from the Osteoarthritis Initiative
Sunday, November 12, 2023
3:15 PM - 3:25 PM PT
Location: Room 25A-C
- SW
Stephanie Wichuk, BA
University of Alberta
Edmonton, AB, CanadaDisclosure information not submitted.
Presenting Author(s)
Banafshe Felfeliyan1, Stephanie Wichuk2, Abhilash Hareendranathan3, Janet Ronsky4 and Jacob Jaremko2, 1University of Alberta, Calgary, AB, Canada, 2University of Alberta, Edmonton, AB, Canada, 3Radiology and Diagnostic Imaging, Edmonton, AB, Canada, 4University of Calgary, Calgary, AB, Canada
Background/Purpose: Knee effusion-synovitis (ES) is an attractive target for therapeutic interventions in arthritis, since it is associated with stiffness, pain, and disease progression to arthroplasty. Rapid, objective methods to assess ES on MRI are desirable. Currently, ES is assessed by global user impression or semi-quantitative tools such MRI OA Knee Score (MOAKS); these approaches have high inter-user variability, are insensitive for change if categories are broad, or are time-consuming if scoring is detailed. To address these limitations, we have developed a novel deep learning (DL) approach to automatically measure ES volume (DL-ES), with high inter-rater reliability ICC=0.96 vs. human expert readers [1].
Here, we automatically generated ES volumes in a from a large subset of Osteoarthritis Initiative (OAI) dataset and assessed validity vs. other imaging scoring systems and clinical findings.
Methods: Total of 4659 MRIs from 1165 individuals with baseline (BL) and 1-year follow-up MOAKS and WOMAC scores were available from the OAI dataset. Scans were processed using a custom IMaskRCNN DL model, previously trained on 700 MRI slices with gold-standard effusion labels from an expert radiologist.
Cases with follow-up time>11 months, total WOMAC score >0, and KL grades < 4 were analyzed(n=656). Criterion validity of DL-ES was assessed through comparison of BL and 1-year change(Δ) in volume with MOAKS whole knee effusion and WOMAC scores via Kendall’s tau and Spearman rank correlation. Differences in DL-ES volumes between KL grades were evaluated via Kruskal-Wallis test.
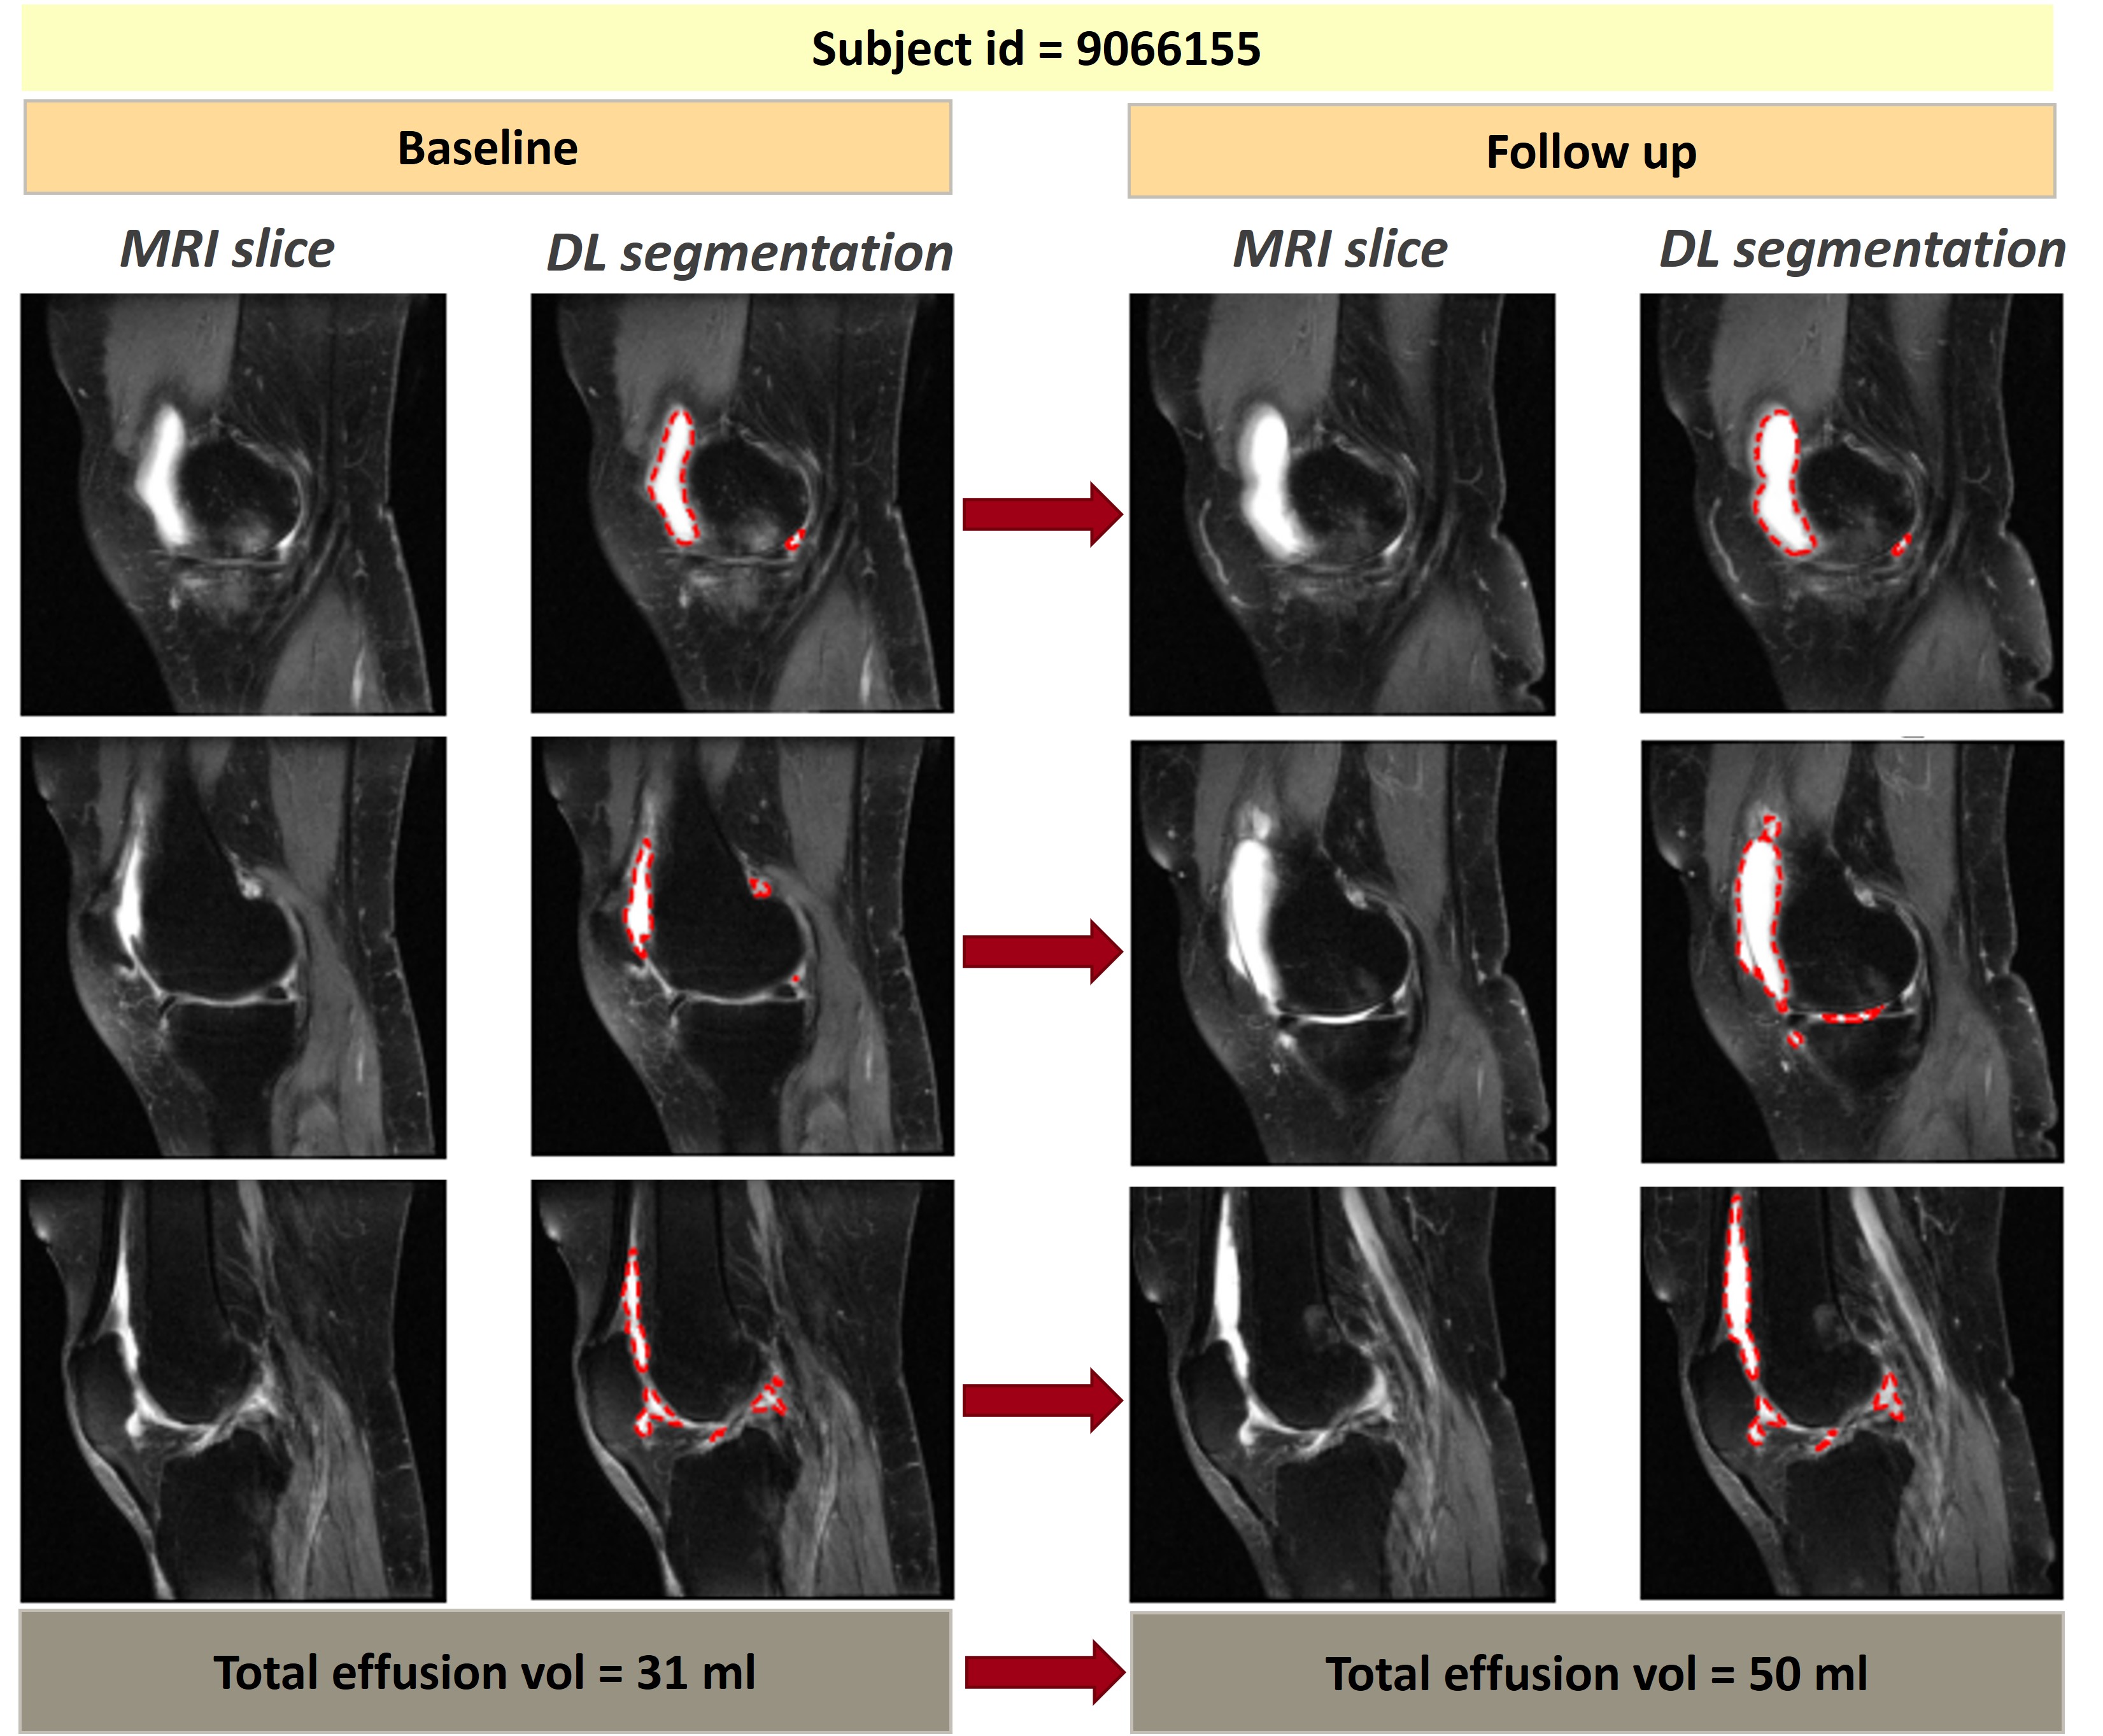
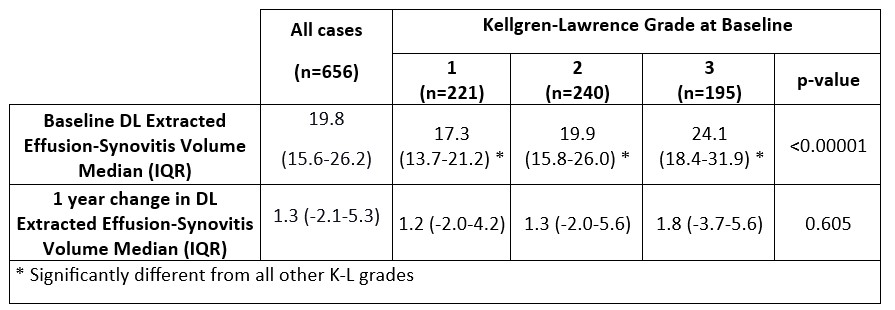
Results: DL-EF calculation took 35 seconds/scan (Fig1). Median (IQR) baseline DL-ES volume was 19.8 (15.6-26.2) mL, with median (IQR) 1-year Δ of 1.3 (-2.1-5.3) mL. Median (IQR) DL-ES volume at BL increased significantly with BL KL Grade [17.3 (13.7-21.2) mL, 19.9 (15.8-26.0) mL, and 24.1 (18.4-31.9) mL for KL grades 1,2, and 3, respectively, p< 0.0001]. There was no significant difference in 1-year Δ in DL-ES between BL KL grades.
There was significant moderate positive correlation between DL-ES and MOAKS effusion BL and Δ scores [Kendall’s tau=0.27 (95% CI 0.21-0.32, p< 0.0001) and 0.30 (95% C 0.24-0.36, p< 0.0001), respectively].
DL-ES volumes showed a small significant positive correlation with WOMAC pain [Spearman’s rho=0.11 (95% CI 0.033-0.18, p=0.005) and 0.1 (95% CI 0.03-0.18, p=0.007) for BL and Δ, respectively], and WOMAC stiffness [Spearman’s rho= 0.08 (95% CI 0.01-0.16, p=0.03) and 0.11 (95% CI 0.04-0.19, p=0.004 for BL and Δ, respectively].
Conclusion: ES volume measured automatically using DL shows promising correlations to manual semiquantitative effusion scoring (MOAKS) and clinical features of knee arthritis (pain and stiffness). As others have found when measuring ES in other ways, we found higher (KL) grades (e.g., 3-4) were associated significantly with larger effusions. These results demonstrate validity of the proposed method for fully automated knee effusion quantification, which may ultimately prove useful in clinical care and clinical trials. [1] Felfeliyan et al., Improved-Mask R-CNN: Towards an accurate generic MSK MRI instance segmentation platform, CMIG 2022


.jpg)
B. Felfeliyan: None; S. Wichuk: None; A. Hareendranathan: None; J. Ronsky: None; J. Jaremko: None.
Background/Purpose: Knee effusion-synovitis (ES) is an attractive target for therapeutic interventions in arthritis, since it is associated with stiffness, pain, and disease progression to arthroplasty. Rapid, objective methods to assess ES on MRI are desirable. Currently, ES is assessed by global user impression or semi-quantitative tools such MRI OA Knee Score (MOAKS); these approaches have high inter-user variability, are insensitive for change if categories are broad, or are time-consuming if scoring is detailed. To address these limitations, we have developed a novel deep learning (DL) approach to automatically measure ES volume (DL-ES), with high inter-rater reliability ICC=0.96 vs. human expert readers [1].
Here, we automatically generated ES volumes in a from a large subset of Osteoarthritis Initiative (OAI) dataset and assessed validity vs. other imaging scoring systems and clinical findings.
Methods: Total of 4659 MRIs from 1165 individuals with baseline (BL) and 1-year follow-up MOAKS and WOMAC scores were available from the OAI dataset. Scans were processed using a custom IMaskRCNN DL model, previously trained on 700 MRI slices with gold-standard effusion labels from an expert radiologist.
Cases with follow-up time>11 months, total WOMAC score >0, and KL grades < 4 were analyzed(n=656). Criterion validity of DL-ES was assessed through comparison of BL and 1-year change(Δ) in volume with MOAKS whole knee effusion and WOMAC scores via Kendall’s tau and Spearman rank correlation. Differences in DL-ES volumes between KL grades were evaluated via Kruskal-Wallis test.
Results: DL-EF calculation took 35 seconds/scan (Fig1). Median (IQR) baseline DL-ES volume was 19.8 (15.6-26.2) mL, with median (IQR) 1-year Δ of 1.3 (-2.1-5.3) mL. Median (IQR) DL-ES volume at BL increased significantly with BL KL Grade [17.3 (13.7-21.2) mL, 19.9 (15.8-26.0) mL, and 24.1 (18.4-31.9) mL for KL grades 1,2, and 3, respectively, p< 0.0001]. There was no significant difference in 1-year Δ in DL-ES between BL KL grades.
There was significant moderate positive correlation between DL-ES and MOAKS effusion BL and Δ scores [Kendall’s tau=0.27 (95% CI 0.21-0.32, p< 0.0001) and 0.30 (95% C 0.24-0.36, p< 0.0001), respectively].
DL-ES volumes showed a small significant positive correlation with WOMAC pain [Spearman’s rho=0.11 (95% CI 0.033-0.18, p=0.005) and 0.1 (95% CI 0.03-0.18, p=0.007) for BL and Δ, respectively], and WOMAC stiffness [Spearman’s rho= 0.08 (95% CI 0.01-0.16, p=0.03) and 0.11 (95% CI 0.04-0.19, p=0.004 for BL and Δ, respectively].
Conclusion: ES volume measured automatically using DL shows promising correlations to manual semiquantitative effusion scoring (MOAKS) and clinical features of knee arthritis (pain and stiffness). As others have found when measuring ES in other ways, we found higher (KL) grades (e.g., 3-4) were associated significantly with larger effusions. These results demonstrate validity of the proposed method for fully automated knee effusion quantification, which may ultimately prove useful in clinical care and clinical trials. [1] Felfeliyan et al., Improved-Mask R-CNN: Towards an accurate generic MSK MRI instance segmentation platform, CMIG 2022

Deep learning effusion segmentation result for one subject at baseline and follow-up

Deep-Learning Extracted Effusion-Synovitis Volume in cases with Kellgren-Lawrence Grades 1,2, and 3.
.jpg)
Kendall’s tau=0.30 (95% C 0.24-0.36, p<0.0001)
B. Felfeliyan: None; S. Wichuk: None; A. Hareendranathan: None; J. Ronsky: None; J. Jaremko: None.


