Thomas Jefferson University Philadelphia, PA, United States
Disclosure information not submitted.
Timothy Wilson1, Brendan Allen2, jonathan harris3, Stephen Humphries4, kristine Kuhn2, kevin Deane3, joyce Lee5, joshua Solomon4 and Kristen Demoruelle3, 1Thomas Jefferson University, Philadelphia, PA, 2University of Colorado School of Medicine, Aurora, CO, 3University of Colorado Anschutz Medical Campus, Aurora, CO, 4National Jewish Health, Denver, CO, 5University of Colorado Anschutz Campus, Denver, CO
Background/Purpose: Rheumatoid arthritis-associated interstitial lung disease (RA-ILD) develops in 5-10% of RA patients and more often manifests as the fibrotic subtype of ILD known as usual interstitial pneumonia (UIP). Fibrotic ILD can also be detected early in patients with RA before meeting criteria for UIP or becoming clinically apparent. RA-UIP contributes significantly to morbidity and mortality, yet the pathophysiology remains poorly understood. In idiopathic pulmonary fibrosis (IPF), which shares significant clinical and pathophysiologic overlap with RA-UIP, lung microbial dysbiosis has been associated with lung disease progression, exacerbations of the underlying ILD and mortality. We evaluated the lung microbiome using induced sputum in RA patients with pulmonary fibrosis (RA-PF) compared to RA patients without pulmonary fibrosis (RA-no-PF) to establish lung microbial relationships with RA-PF and lung disease severity.
Methods: We included 33 patients with RA-PF and 32 patients with RA-no-PF. Presence or absence of PF was determined by high resolution computed tomography (HRCT) read by two chest radiologists blinded to patient characteristics. The RA-PF group included 1) patients with HRCT evidence of early fibrosis but no clinical diagnosis of ILD and 2) patients with established ILD in a radiographic pattern of UIP. Patients with other forms of ILD (e.g., nonspecific interstitial pneumonia) were excluded. Induced sputum was collected from all participants and underwent 16s rRNA microbiome sequencing (MiSeq). Sputum was also tested for levels of pro-inflammatory cytokines (multiplex immunoassay, Meso Scale Discovery). Pulmonary function tests and HRCT were performed within 3 months of sputum collection. Lung fibrosis was quantified by HRCT using the data-driven textural analysis (DTA) computer method. Linear discriminant effect size analysis (LEfSe) was used to identify differences in relative abundance of genus-level taxa between groups.
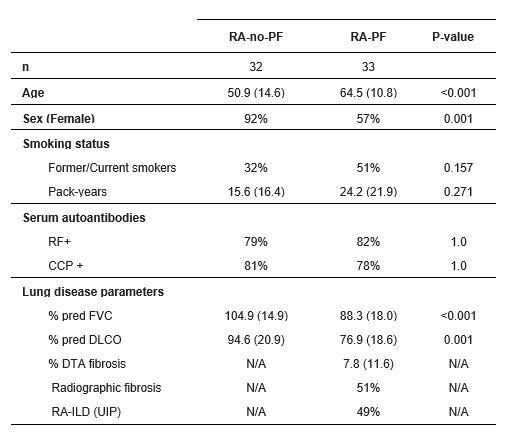
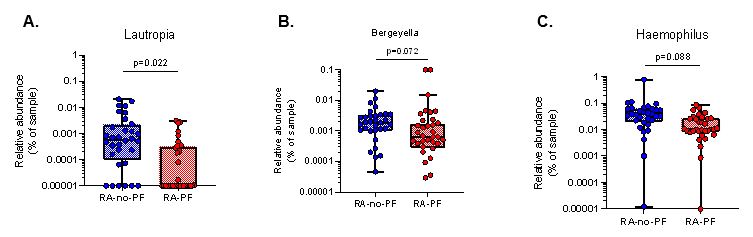
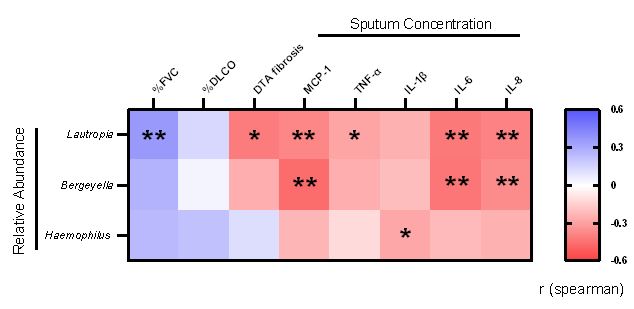
Results: Demographics and clinical data are shown in Table 1. There were no differences in alpha or beta diversity between groups. In the LEfSe analysis, we found a significantly lower abundance of Lautropia, Bergeyella, and Haemophilus in RA-PF compared to RA-no-PF (Figure 1). Of these taxa, lower abundance of Lautropia significantly correlated with reduced % predicted forced vital capacity (%FVC; r=0.364, p=0.004) and increased extent of lung fibrosis (r=-0.414, p=0.032) (Figure 2). Additionally, decreased abundance of all three taxa were significantly associated with increased levels of various inflammatory cytokines within sputum, including MCP-1, TNF-α, IL-1β, IL-6, and IL-8 (Figure 2).
Conclusion: We found taxonomic level differences in the lung microbiome of RA patients with pulmonary fibrosis. Of particular interest, Lautropia was lower in RA-PF and lower abundance significantly correlated with impaired lung physiology, higher lung fibrosis and higher levels of local inflammatory cytokines. Future studies are needed to investigate the role of Lautropia and other respiratory microbes in driving fibrotic, or perhaps anti-fibrotic, changes within the lungs of RA patients.
Table 1. Patient demographics and clinical characteristics
Figure 1. Significant taxa differences at genus level in RA-PF compared to RA-no-PF (A. Lautropia; B. Bergeyella; C. Haemophilus). Read count data was filtered with a minimum read count cutoff of 4 and prevalence in samples of 20%, and a feature low variance cutoff of 10% based on inter-quartile range (IQR). Read counts were rarefied to the minimum library size and scaled using the cumulative sum scaling (CSS) method. Significant differences determined using a linear discriminant effect size analysis (LEfSe) and false discovery rate (FDR) adjusted p-value <0.1.
Figure 2. Heatmap of spearman correlation analysis of taxa abundance with markers of lung disease severity and sputum cytokine levels. %FVC = % pre-dicted forced vital capacity, %DLCO = %predicted diffusion capacity carbon monoxide, DTA fibrosis = data drive textural analysis HRCT fibrosis score, MCP-1 = monocyte chemoattractant protein 1, TNF-α = tumor necrosis factor alpha, IL-1β = interleukin 1 beta, IL-6 = interleukin 6, IL-8 = interleukin 8. P-value based on spearman correlation, <0.05 = *, <0.01 = **.
T. Wilson: None; B. Allen: None; j. harris: None; S. Humphries: None; k. Kuhn: pfizer, 5, ucb, 2; k. Deane: Bristol-Myers Squibb(BMS), 1, Gilead, 5, Janssen, 5, Werfen, 1, 12, Biomarker kits; j. Lee: Blade, 2, Boehringer-Ingelheim, 1, 5, Eleven P15, 2, Pliant, 5, United Therapeutics, 1; j. Solomon: None; K. Demoruelle: Boehringer-Ingelheim, 5, Gilead, 5, Pfizer, 5.