1714: Aberrant Myeloid Populations in the TNF-Transgenic Model of Pulmonary Hypertension Overexpress Interferon Pathways and Are Driven by TNFR1 Signaling
University of Rochester Rochester, NY, United States
Disclosure information not submitted.
Gaochan Wang1, Qingfu Xu2, Stacey Duemmel1 and Benjamin Korman1, 1University of Rochester, Rochester, NY, 2University of Rochester Medical Center, Rochester, NY
Background/Purpose: Pulmonary hypertension (PH) is a severe, progressive disorder characterized by elevated pulmonary artery pressures, right ventricular hypertrophy, and increased mortality. We previously demonstrated that TNF-transgenic (TNF-Tg) mice develop a severe PH phenotype and that deficiency of TNFR1 reversed this pathology. To explore the roles of immune cells contributing to PAH in TNF-Tg mouse model, we assessed single-cell RNA expression of immune cells in TNF-Tg mice crossed with mice lacking TNFR1 or TNFR2.Because we saw dramatic shifts in myeloid populations, we focused on characterizing the abnormal monocytes and macrophages present in TNF lungs.
Methods: TNF-Tg mice were crossed with mice deficient in either TNFR1(TNFR1KO) or TNFR2 (TNFR2KO). Lungs from wild type, TNF-Tg, TNF-Tg-TNFR1KO and TNF-Tg-TNFR2KO mice (n = 5–6) at 4.5 months of age were harvested and digested to a single cell suspension for single cell RNA sequencing (scRNAseq). The library was prepared using 10X Genomics Chromium instrument and sequencing was performed on Illumina NovaSeq6000. scRNAseq reads were examined for quality and mapped to reference mouse genome. The resulting scRNAseq data was analyzed with Seurat v.4.9. Differential expression and pathways analysis were performed and visualized using Seurat and R packages enrichR and Enhanced Volcano.
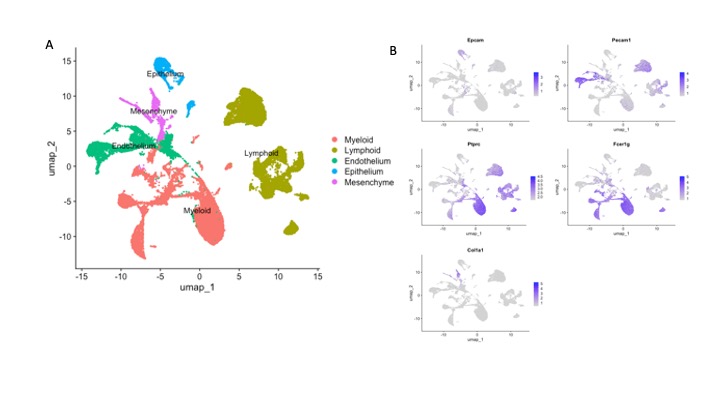
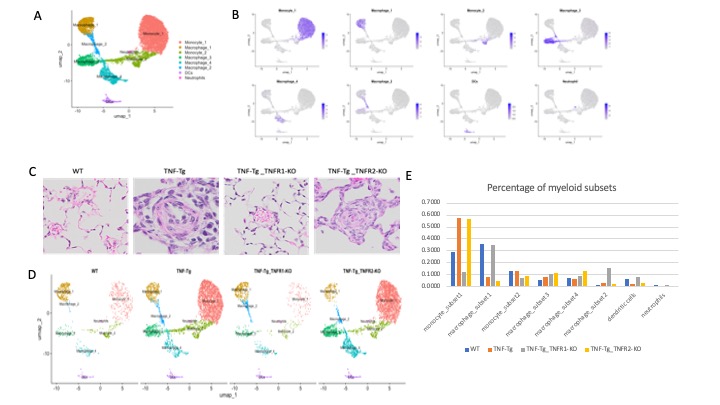
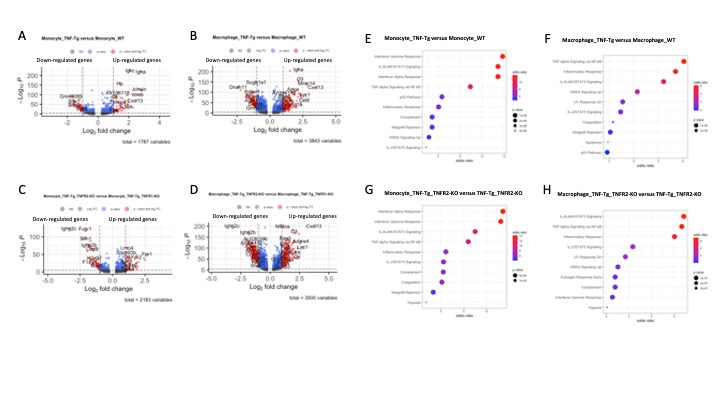
Results: Cells were clustered based on their expression profiles and cell types were annotated based on established cell markers from Lung Map and the published literature. A total of 40 clusters were identified, corresponding to 5 major cell groups (Fig 1.A-B): epithelial (Epcam+), endothelial (Pecam1+), mesenchymal (Col1a1+), lymphoid (Ptprc+), and myeloid (Ptprc+ and Fcer1g+). We observed dramatic changes in cellular composition of myeloid cells between WT and TNF-Tg, and TNF-Tg_TNFR1-KO and TNF-Tg_TNFR2-KO. We focused on myeloid cells and re-clustered these cells to identify 7 myeloid cell types (2 monocytes subsets, 4 macrophage subsets, neutrophils, and dendritic cells) were identified (Fig 2.A-B). Among the myeloid cells, monocytes and macrophages account for the dramatic changes in cellular composition. Moreover, WT and TNF-Tg-TNFR1KO mice shared the similar cellular composition, and TNF-Tg and TNF-Tg-TNFR2KO mice shared the similar cellular composition (Fig 2.D), which was consistent with the whole cellular composition in 4 mouse groups and lung histology (Fig 2.C). We next performed differential expression analysis in monocytes and macrophages (Fig 3. A-D). In monocytes, interferon responses and complement signaling were significantly differentially expressed in both TNF-Tg and TNF-Tg_TNFR2-KO mice. In macrophages, a majority of pathways related to TNF-mediated NK-kB signaling pathways and JAK/STAT signaling in TNF-Tg and TNF-Tg_TNFR2-KO mice (Fig 3. E-H).
Conclusion: Overexpression of TNF results in significant shifts in cellular composition of pulmonary myeloid cells. TNFR1 signaling is primarily responsible for these changes. Pathway analysis suggests that lung monocyte-mediated interferon responses contribute to the pathogenesis of PH.
Figure 1. Cellular composition of major cell types in mouse lung. A. UMAP projection of all scRNA-seq data, showing 5 major cell groups that were identified. B. Feature plots identifying canonical markers of epithelial (Epcam), endothelial (Pecam1), mesenchymal (Col1a1), myeloid (Ptprc, Fcer1g) and lymphoid (Ptprc+, Fcer1g-) cells populations.
Figure 2. Cellular composition of myeloid cells identified in mouse lung from TNF-Tg and TNF receptor deficient mice. A. A total of eight clusters of myeloid cells were identified from mice across all genotypes. Cell populations are colored as indicated by legend. B. Feature plots showing expression of principal identifiers of different myeloid cell types. C. Lung histology images demonstrated that TNF-Tg and TNF-Tg_TNFR2-KO mice, but not WT and TNF-Tg_TNFR1-KO mice have pulmonary inflammation and vascular occlusion. D. UMAP plots myeloid subsets in TNF-Tg mice with and without TNF receptor deficiency. Cell populations are colored as indicated by legend. E. Proportion of myeloid subsets across genotypes.
Figure 3. Differential expression (DE) analysis of genes and pathways in monocytes and macrophages. A-B. Volcano plot showing the differentially expressed genes in monocytes and macrophage between TNF-Tg and WT mice. C-D. Volcano plot showing the differentially expressed genes in monocytes and macrophage between TNF-Tg_TNFR2-KO and TNF-Tg_TNFR1-KO mice. E-F. Pathway analysis in monocytes. G-H. Pathway analysis in macrophages. MSigDB_Hallmark_2020 database was used for analysis. Dot plots identify pathways in descending significance of p-value (dot size) and odds-ration (color).
G. Wang: None; Q. Xu: None; S. Duemmel: None; B. Korman: Teneofour, Inc, 2.