0911: Spatial Transcriptomics Reveals Normal-density and Low-density Neutrophils Are More Prevalent Than Macrophages in Lupus Nephritis Glomeruli, and Urine DNA Methylation Analyses Capture Both Myeloid Populations
Dartmouth-Hitchcock Medical Center Lebanon, NH, United States
Disclosure information not submitted.
Sladjana Skopelja-Gardner1, Joshua Skydel2, Alecia Roy3, Brenna Kerin3, James Whitley3, Fred Kolling4, Noelle Kosarek4, Michelle Petri5, Andrea Fava6, Lucas Salas7 and Christopher Burns3, 1Department of Medicine, Dartmouth Hitchcock Medical Center, Geisel School of Medicine at Dartmouth, Lebanon, NH, 2Dartmouth-Hitchcock Medical Center, Lebanon, NH, 3Dartmouth Hitchcock Medical Center, Lebanon, NH, 4Geisel School of Medicine at Dartmouth, Hanover, NH, 5Department of Medicine, Division of Rheumatology, Johns Hopkins University School of Medicine, Timonium, MD, 6Department of Medicine, Johns Hopkins University School of Medicine, Baltimore, MD, 7Department of Epidemiology, Geisel School of Medicine at Dartmouth, Lebanon, NH
Background/Purpose: Despite compelling evidence that normal-density (NDN) and low-density neutrophils (LDN) are activated in the blood of lupus patients, their role in lupus nephritis (LN) remains elusive. This large gap in knowledge stems from the limitations in approaches to capture and profile neutrophils. Neither NDNs nor LDNs are usually captured in scRNAseq studies of LN kidneys and urine due to their loss by sample freezing, potentially skewing the conclusions that monocytes or macrophages are the dominant pathogenic myeloid cell population in LN.
Methods: Neutrophils were detected in LN kidneys by IHC staining of neutrophil elastase (NE, n = 19). Spatial transcriptomics was performed on class III/IV LN patients using Visium 10X Genomics. Differential expressed genes (DEGs) between neutrophils (NDN, LDN) and Mos were defined using publicly available RNAseq data. Spots containing NDNs, LDNs, and Mos and their glomerular vs tubular location were defined using Variance Adjusted-Mahalanobis to compute cell-specific pathway scores based on DEGs. Neutrophils and macrophages were quantified in urine cell pellets of SLE patients (+/- LN), collected at Dartmouth Hitchcock Lupus Clinic and the Johns Hopkins Lupus Center, by deconvolution of DNA methylation data (DNAm, Illumina EPIC).
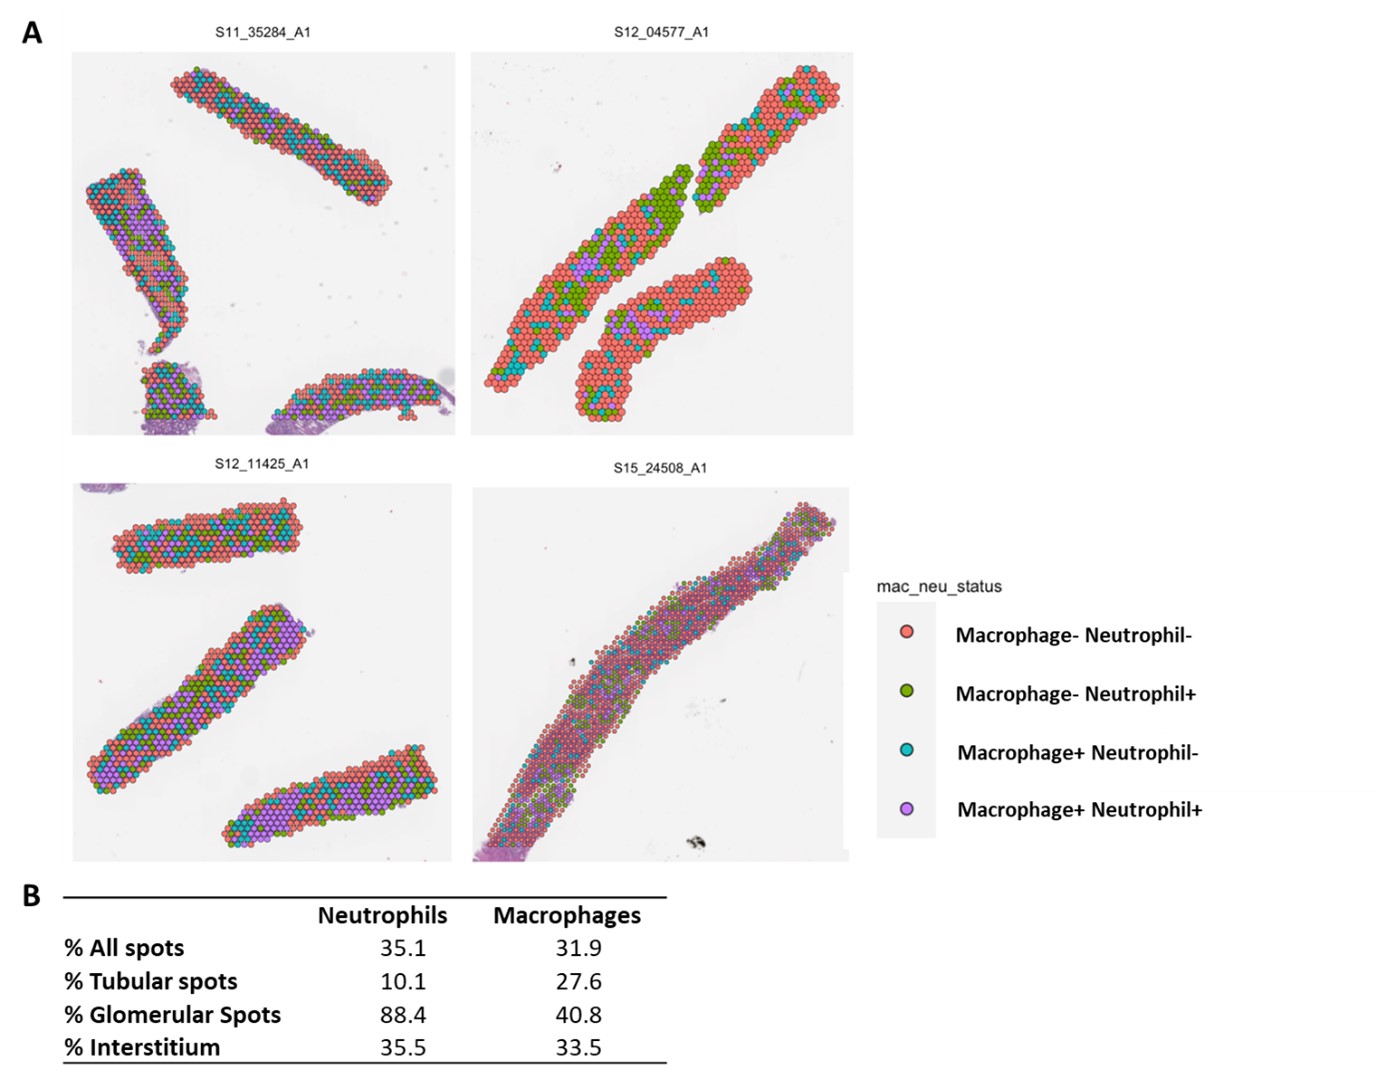
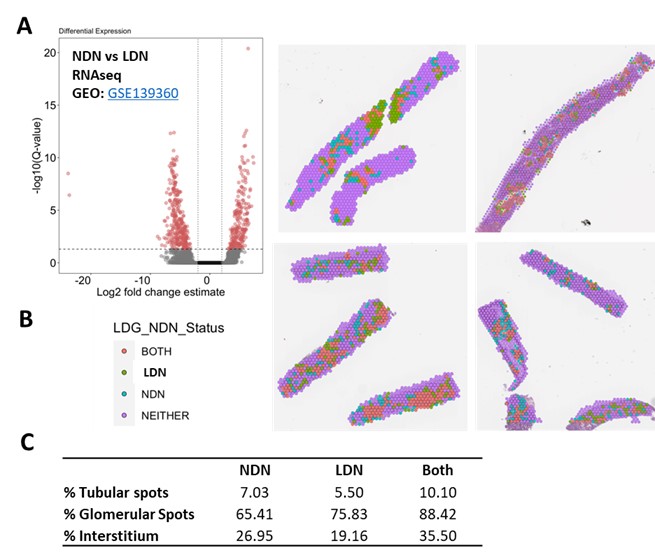
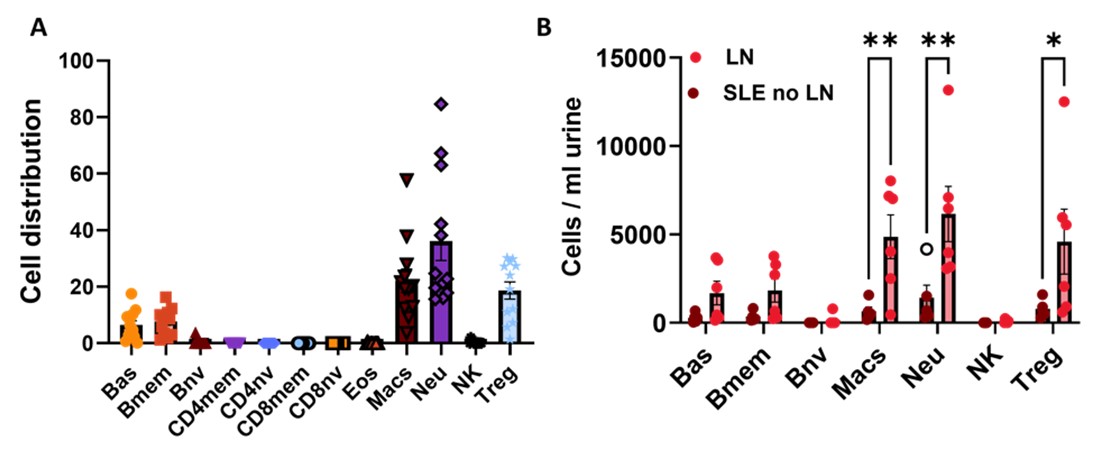
Results: Glomerular neutrophil numbers in LN kidneys (#NE+ cells/glomerulus) inversely correlated with serum C3 levels (r = -0.671, **p = 0.0056), supporting a role for neutrophils in disease pathogenesis. Neutrophils were equally or more represented in LN kidneys compared to macrophages: 35% vs. 32% of all spots (Fig. 1). Macrophages preferentially localized to the tubules vs. neutrophils (27% vs. 10%) but, strikingly, neutrophils localized to glomerular regions to a much greater extent (41% vs 88%). Similar interstitial distribution was found for both myeloid cell populations. Both NDNs and LDNs infiltrated LN tissues at comparable levels (Fig. 2). LDNs were the more predominant neutrophil population in the glomeruli: 76% LDN+ spots vs. 65% NDN+ spots. NDNs were the more predominant neutrophil population in both tubular and interstitial areas: 5% LDN+ spots vs. 7% NDN+ spots in tubules; 19% LDN+ spots vs. 27% NDN+ spots in the interstitium. The most prevalent NDN subtype in tubular regions was mature and transcriptionally quiescent neutrophils (Nh2), whereas immature and interferon+ NDNs were the prevalent subtype in glomeruli. DNAm analysis of urine cell pellets recapitulated high neutrophil and macrophage presence in LN kidneys (Fig. 3). Higher macrophage levels were found in urine cell pellets of SLE patients with active LN. There was a significant correlation between urine macrophage levels with UPCR (r = 0.64, **p = 0.008) and disease activity (SLEDAI >5, *p = 0.05).
Conclusion: Neutrophils, not only macrophages, are highly abundant in LN kidneys. Both NDNs and LDNs are highly prevalent myeloid cells in LN kidneys with predominantly glomerular localization. Spatial transcriptomics and urine DNA methylation approaches overcome the shortcomings of scRNAseq and are useful tools to define the pathogenic role of myeloid cells in LN.
Fig. 1 Lupus Nephritis kidney spatial transcriptomics data reveal Macrophage and Neutrophil populations in situ. (A) Transcriptional pathways scores are defined by Variance Adjusted-Mahalanobis (VAM) method to compute cell specific pathway scores based on differentially expressed genes between neutrophils and macrophages on the 10x Visium (n = 4 LN class III/IV). (B) Percent NDN+ and LDN+ spots in LN kidney regions defined by VAM scores of unique gene signatures.
Fig. 2 Both NDNs and LDNs localize to LN kidneys. (A) Differentially expressed genes between lupus NDNs and LDNs were defined using RNAseq data from the Mistry et al 2019 PNAS study (n = 6 samples per group). (B) Spots containing NDNs and LDNs were defined using Variance Adjusted-Mahalanobis (VAM) to compute cell-specific pathway scores based on differentially expressed genes in A. (C) Percent NDN+ and LDN+ spots in LN kidney regions defined by VAM scores of unique gene signatures.
Fig. 3 Urine DNAm Deconvolution reveals (A) high Macrophage (Macs) and Neutrophil (Neu) cell distribution in lupus urine and (B) Increased Macs and Neu cells/ml urine in lupus (SLE) patients with LN vs. SLE patients without LN. One-way ANOVA, *p< 0.05, **p < 0.01