Poster Session B
Systemic lupus erythematosus (SLE)
Session: (0886–0898) SLE – Animal Models Poster
0894: The Cellular and Spatial Type I Interferon Response Following Skin Exposure to Ultraviolet Light
Monday, November 13, 2023
9:00 AM - 11:00 AM PT
Location: Poster Hall
- JA
Jie An, PhD
University of Washington
Seattle, WA, United StatesDisclosure information not submitted.
Abstract Poster Presenter(s)
Jie An1, Xizhang Sun1, Rayan Najjar1, Connie Zhao1, Paul Kong2, Stephanie Weaver2, Amanda Koehne2, Matt Fitzgibbon2 and Keith Elkon1, 1University of Washington, Seattle, WA, 2Fred Hutchinson Cancer Center, Seattle, WA
Background/Purpose: SLE patients characteristically have a prominent type I interferon (IFN-I) signature in lesional and non-lesional skin. We recently demonstrated that, following a single exposure to ultraviolet light (UVB), UVB induces an IFN signature not only in the skin but also in the blood and kidneys of wild type mice. We asked three questions: which cells (skin or immune) are responsible for IFN-I production? 2) which subset of immune cells or which part of the skin are responsible for IFN-I production after UV? And 3) What are the different Type I IFNs (IFN-a, IFN-b, IFN-k) being made after UV exposure?
Methods: Shaved mouse skin received a single exposure of 500 mJ/cm2 UVB and biopsies taken at time 0 and then 6, 12 and 24 hours after UVB exposure (n=3 per groups). Single cell nuclear RNA sequencing (snRNAseq) used Illumina Nextseq protocols with bioinformatics utilizing Monocle and Seurat pipelines. In situ hybridization (ISH) was performed with IFN-alpha consensus (IFNac), beta (b) and kappa (k) probes with HALO software for quantification. For spatial transcriptomics analysis, fixed tissue was first stained with antibodies to CD45 and to cytokeratin (CK) to mark immune cells and keratinocytes respectively. 7 regions of interest were selected and processed on the GeoMx digital spatial profiler. We used the mouse whole transcriptome probe set for next generation sequence analysis and results processed on the nanoString software Suite 2.5.1.145. Pathway analysis was determined by Gene Set Enrichment Analysis using the curated mouse gene set collection from MSigDB (2626 gene set).
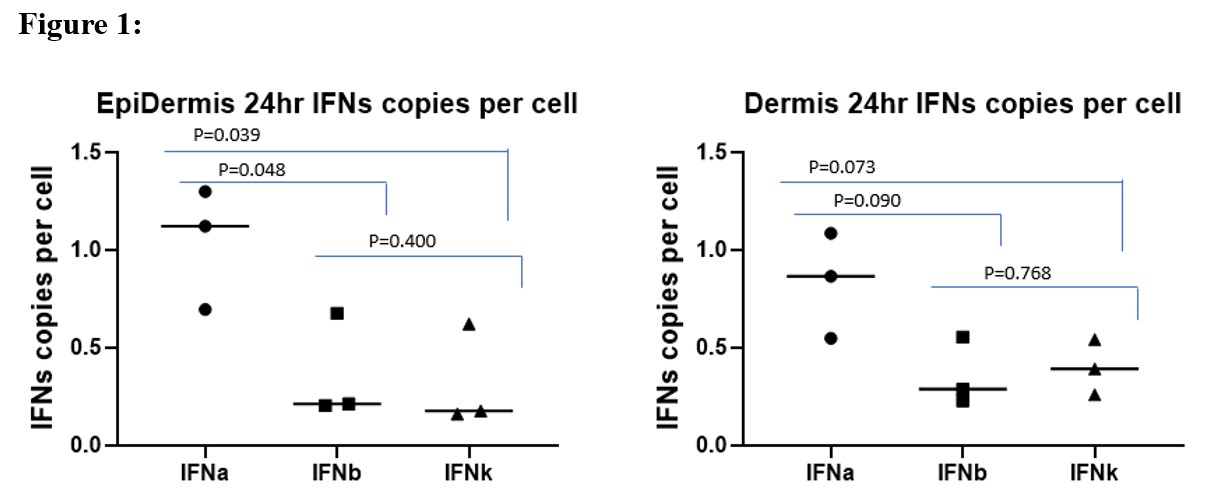
Results: SnRNAseq revealed that ISGs such as Ifit1, Isg15 and Isg20 were significantly increased at 24 hr post UV (p adj < 10-5) relative to baseline. When ISG expression was clustered by cell type, the highest Isg15 and Isg20 expression was seen in two epidermal clusters (p adj < 10-5 and 10-10 respectively). Utilized the ISH approach, we observed the highest signals in the epidermal region for IFN-ac ( > 1 copy/ cell) versus IFN-b and IFN-k (< 1 copy/ cell). Whole transcriptome spatial analysis confirmed highest Isg15 and 20 expression in the cytokeratin positive cells. When the top 20 pathways activated by UV at 6 hr in the epidermis and dermis were compared, statistically significant differences (p adj < 0.01) in the cytokeratin positive cells included apoptosis, epigenetic (H3K27ME3), and NFkb targets whereas in the CD45 cell population, differences in GVHD, innate immune system, platelet activation and brown myeloid cell development were observed. At 24 hr post UV, significant changes were observed in multiple RNA processing reactomes in both cytokeratin and CD45+ cells. In the dermis, an increase in several lipid and fatty acid reactomes occurred.
Conclusion: We have identified the spatial locations of different IFN-I species in the skin following UV light injury. Copy number was highest in the epidermis for IFN-ac. Spatial transcriptomics also illuminates differences in inflammatory versus metabolic programs that are activated in immune (CD45) versus epidermal (cytokeratin positive) and dermal locations. These studies will lead to better understanding of how UV inflammation provokes lupus in susceptible individuals.

J. An: None; X. Sun: None; R. Najjar: None; C. Zhao: None; P. Kong: None; S. Weaver: None; A. Koehne: None; M. Fitzgibbon: None; K. Elkon: None.
Background/Purpose: SLE patients characteristically have a prominent type I interferon (IFN-I) signature in lesional and non-lesional skin. We recently demonstrated that, following a single exposure to ultraviolet light (UVB), UVB induces an IFN signature not only in the skin but also in the blood and kidneys of wild type mice. We asked three questions: which cells (skin or immune) are responsible for IFN-I production? 2) which subset of immune cells or which part of the skin are responsible for IFN-I production after UV? And 3) What are the different Type I IFNs (IFN-a, IFN-b, IFN-k) being made after UV exposure?
Methods: Shaved mouse skin received a single exposure of 500 mJ/cm2 UVB and biopsies taken at time 0 and then 6, 12 and 24 hours after UVB exposure (n=3 per groups). Single cell nuclear RNA sequencing (snRNAseq) used Illumina Nextseq protocols with bioinformatics utilizing Monocle and Seurat pipelines. In situ hybridization (ISH) was performed with IFN-alpha consensus (IFNac), beta (b) and kappa (k) probes with HALO software for quantification. For spatial transcriptomics analysis, fixed tissue was first stained with antibodies to CD45 and to cytokeratin (CK) to mark immune cells and keratinocytes respectively. 7 regions of interest were selected and processed on the GeoMx digital spatial profiler. We used the mouse whole transcriptome probe set for next generation sequence analysis and results processed on the nanoString software Suite 2.5.1.145. Pathway analysis was determined by Gene Set Enrichment Analysis using the curated mouse gene set collection from MSigDB (2626 gene set).
Results: SnRNAseq revealed that ISGs such as Ifit1, Isg15 and Isg20 were significantly increased at 24 hr post UV (p adj < 10-5) relative to baseline. When ISG expression was clustered by cell type, the highest Isg15 and Isg20 expression was seen in two epidermal clusters (p adj < 10-5 and 10-10 respectively). Utilized the ISH approach, we observed the highest signals in the epidermal region for IFN-ac ( > 1 copy/ cell) versus IFN-b and IFN-k (< 1 copy/ cell). Whole transcriptome spatial analysis confirmed highest Isg15 and 20 expression in the cytokeratin positive cells. When the top 20 pathways activated by UV at 6 hr in the epidermis and dermis were compared, statistically significant differences (p adj < 0.01) in the cytokeratin positive cells included apoptosis, epigenetic (H3K27ME3), and NFkb targets whereas in the CD45 cell population, differences in GVHD, innate immune system, platelet activation and brown myeloid cell development were observed. At 24 hr post UV, significant changes were observed in multiple RNA processing reactomes in both cytokeratin and CD45+ cells. In the dermis, an increase in several lipid and fatty acid reactomes occurred.
Conclusion: We have identified the spatial locations of different IFN-I species in the skin following UV light injury. Copy number was highest in the epidermis for IFN-ac. Spatial transcriptomics also illuminates differences in inflammatory versus metabolic programs that are activated in immune (CD45) versus epidermal (cytokeratin positive) and dermal locations. These studies will lead to better understanding of how UV inflammation provokes lupus in susceptible individuals.

Figure 1. Average copy number of interferon alpha (consensus), beta and kappa in the epidermis (left) and dermis (right) at 24 hrs following skin exposure to UV light.
J. An: None; X. Sun: None; R. Najjar: None; C. Zhao: None; P. Kong: None; S. Weaver: None; A. Koehne: None; M. Fitzgibbon: None; K. Elkon: None.


