Amala Ambati1, Feiyang Ma1, Katarina Kmetova1, Sherwin Navaz1, Claire Hoy1, Cyrus Sarosh1, Ajay Tambralli1, Johann E. Gudjonsson1, J. Michelle Kahlenberg1, Jacqueline Madison1, Ali Duarte-Garcia2, Jason Knight1 and Yu Zuo1, 1University of Michigan, Ann Arbor, MI, 2Mayo Clinic, Rochester, MN
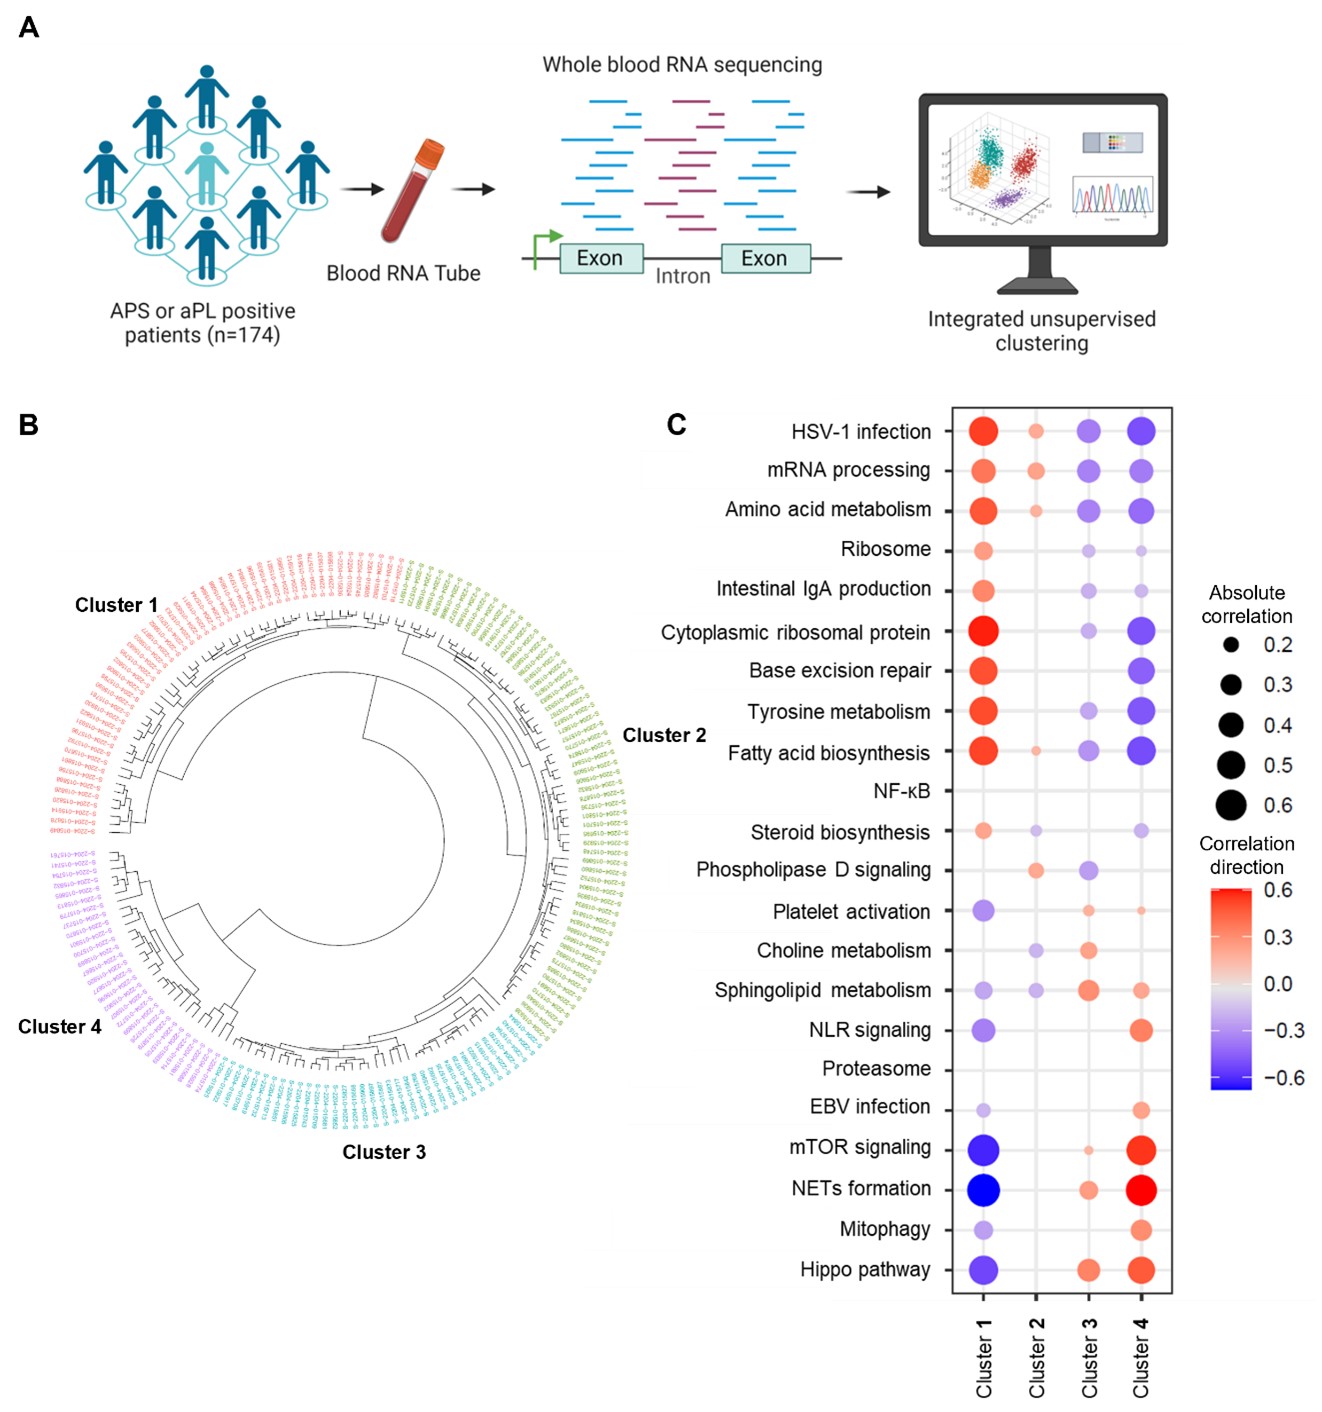
Background/Purpose: Antiphospholipid syndrome (APS) is an acquired thrombo-inflammatory disease associated with diverse clinical manifestations in the setting of persistent antiphospholipid antibodies (aPL). Early diagnosis and more targeted therapies would likely improve outcomes, but both are hindered by clinical and pathogenic heterogeneity. There is an urgent need for modern approaches to the diagnosis and endotypic stratification of aPL-positive patients. We aimed to utilize integrative analyses of data derived from the whole-blood RNA transcriptome to cluster aPL-positive patients by gene expression to identify pathogenic pathways that might be therapeutic targets.
Methods: Whole-blood RNA sequencing was performed on 102 patients with primary APS, 29 with secondary APS, and 43 with persistently positive aPL but without “criteria” APS manifestations. Unsupervised machine learning of the whole-blood transcriptome was undertaken. Deconvolution analysis was further used to estimate the different cell types and their abundance in each sample.
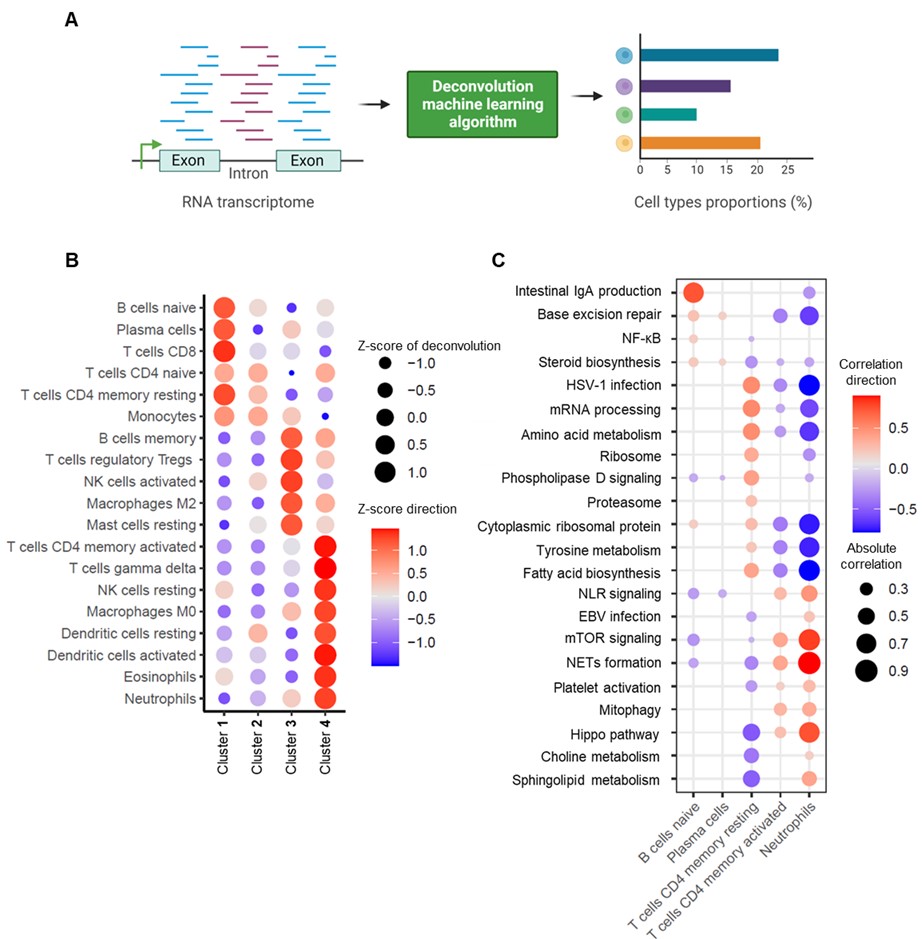
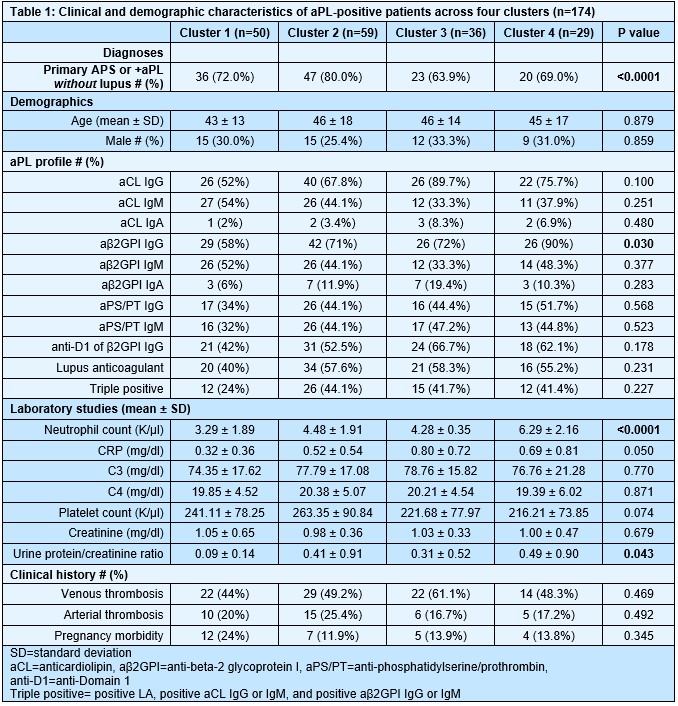
Results: We found that aPL-positive patients could be stratified into four major clusters defined by unique gene expression modules (Fig 1A-B). Pathway analysis revealed that neutrophil extracellular trap (NET) formation, mammalian target of rapamycin (mTOR) signaling, and Hippo pathway signaling were top-upregulated pathways among patients in cluster 4. In contrast, patients in cluster 1 tended to have upregulated genes related to cytoplasmic ribosomal proteins, tyrosine metabolism, and fatty acid biosynthesis, amongst other pathways (Fig 1C). When looking at the associations between pathway-focused gene expression modules and various extra-criteria clinical manifestations of APS, white matter lesions were associated with upregulated NF-κB-related genes (r=0.33, p< 0.0001), and seizures were associated with upregulated choline metabolism-related genes (r=0.2, p=0.009). Meanwhile, cardiac valve disease was associated with NET formation (r=0.18, p=0.02) and the Hippo pathway (r=0.18, p=0.02). Deconvolution analysis demonstrated distinct immune cell type distributions among different clusters of patients (Fig 2A). For example, patients in cluster 4 were predicted to have more myeloid cells, such as neutrophils, eosinophils, and dendritic cells. In contrast, patients in cluster 1 had high proportions of lymphoid cells, such as B cells, plasma cells, and CD8 T cells (Fig 2B). Our analysis also revealed several significant associations between immune cell types and pathway-focused gene modules, including an association between neutrophils and the Hippo pathway, the mTOR pathway, and NET formation (Fig 2C). Clinically, patients in cluster 4 were more likely to have positive testing for anti-beta-2 glycoprotein I IgG, higher absolute neutrophil counts, and increased urine protein-to-creatinine ratio (Table 1).
Conclusion: Our study shows, for the first time, that aPL-positive patients can be stratified into four major clusters defined by pathway-focused gene expression modules and predicted immune cell-type compositions. The results obtained in this study are a first step toward the goal of personalized medicine for patients living with APS.
Figure 1. A, Schematic illustration of study design and whole-blood RNA sequencing. The figure was created at www.biorender.com. B, Unsupervised hierarchical clustering was used to stratify aPL-positive patients into four clusters. C, Dot plots demonstrating associations between pathway-specific gene modules and each cluster of aPL-positive patients. Only statistically significant associations are shown.
Figure 2. A, Schematic illustration of deconvolution analysis of whole-blood transcriptomic data. Cell type deconvolution was performed using CybersortX with the LM22 (22 immune cell types) as the signature matrix. The figure was created at www.biorender.com. B, Dot plot demonstrating associations between immune-cell types and each cluster of aPL-positive patients. C, Dot plot demonstrating associations between pathway-specific gene modules and immune-cell types. Only statistically significant associations are shown.
A. Ambati: None; F. Ma: None; K. Kmetova: None; S. Navaz: None; C. Hoy: None; C. Sarosh: None; A. Tambralli: None; J. Gudjonsson: Abbvie, 2, 5, Almirall, 2, 5, AnaptysBio, 2, Boehringer Ingelheim, 2, Celgene/BMS, 2, 5, Eli Lilly, 2, 5, Galderma, 2, Janssen, 2, 5, Kyowa Kirin, 5, MiRagen, 2, Novartis, 2, Prometheus Biosciences, 5, Sanofi, 2, SunPharma, 5, TimberPharma, 5; J. Kahlenberg: AstraZeneca, 1, Bristol-Myers Squibb(BMS), 2, 5, EMD Serano, 2, exo therapeutics, 2, Gilead, 2, GlaxoSmithKlein(GSK), 1, horizon Therapeutics, 2, Janssen, 5, Pfizer, 2, ROME Therapeutics, 2, 5, Rome Therapeutics, 5, Ventus Therapeutics, 2, 5; J. Madison: None; A. Duarte-Garcia: None; J. Knight: Jazz Pharmaceuticals, 2; Y. Zuo: None.