Ruijin Hospital affiliated to Shanghai Jiaotong University School of Medicine Shanghai, Shanghai, China
Disclosure information not submitted.
Junna Ye1, Yijun You2, Zhuochao Zhou2, Fan wang2, Jingyi Wu2 and Chengde Yang2, 1Ruijin Hospital affiliated to Shanghai Jiaotong University School of Medicine, Shanghai, China, 2Ruijin Hospital, Shanghai Jiao Tong University School of Medicine, Shanghai, China
Background/Purpose: Persistent presence of antiphospholipid antibodies (aPLs) are important thrombosis-related laboratory parameters, as well as an indication of anticoagulation use which usually cause higher bleeding risk. Cerebral microbleeds (CMBs) are strongly associated with both bleeding propensity and ischemic events. Till now, the correlation between aPLs and CMBs remained unclear.
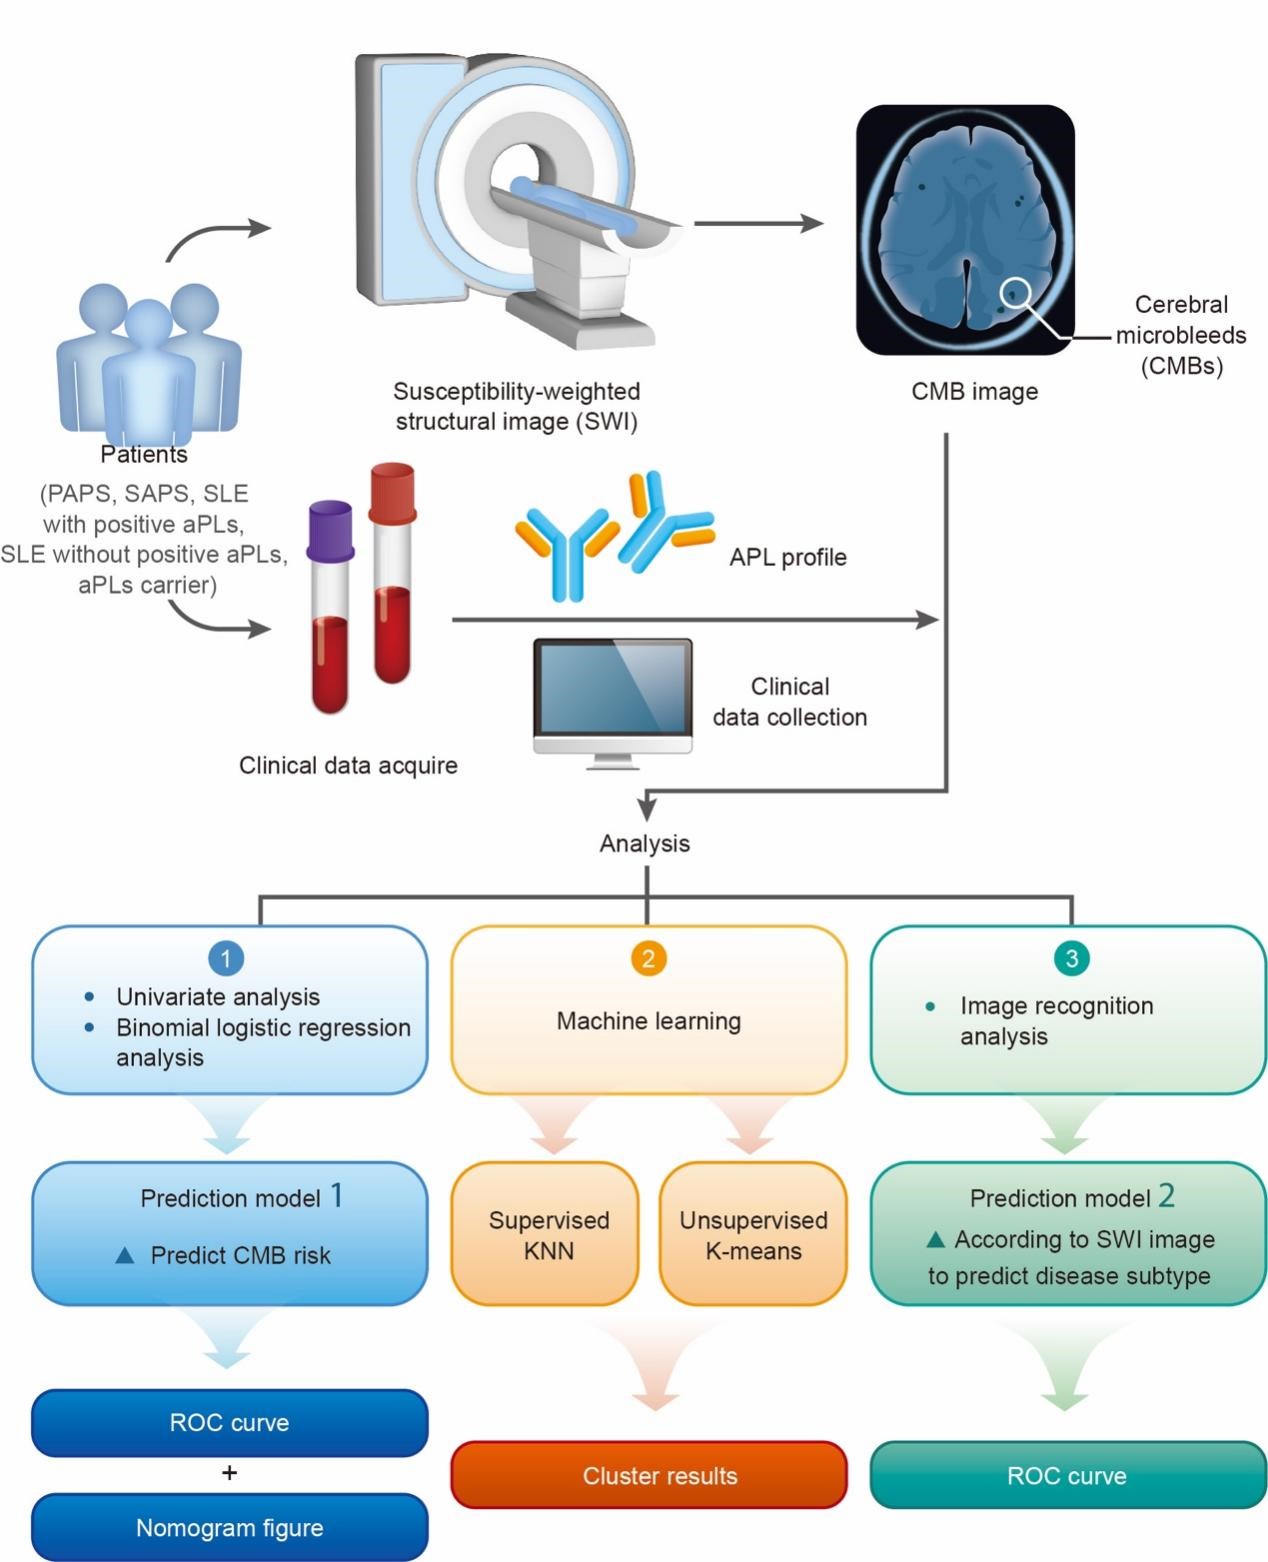
Methods: 31 primary antiphospholipid syndrome (APS), 50 secondary APS, 19 systemic lupus erythematosus (SLE) with positive aPLs, 44 SLE without positive aPLs and 16 aPLs carriers were enrolled from 2018 to 2021 in the Department of Rheumatology and Immunology in Ruijin Hospital. Clinical data, aPLs profile and susceptibility-weighted imaging(SWI) data were collected. Statistical analysis, machine learning, and image recognition analysis were performed from September 2022 to December 2022. Univariate and binomial logistic regression (prediction model 1) analysis was performed to investigate the risk factors of CMBs. Differences in CMBs between those with or without aPLs were analyzed by machine learning (supervised K-Nearest Neighbor (KNN) classification and unsupervised K-means clustering analysis) in SLE patients. Then, an image recognition analysis (prediction model 2) was conducted to build a model to predict the disease subtypes. Receiver operating characteristic (ROC) curve and nomogram representation of the binomial logistic regression analysis for CMBs risk and ROC curve of the image recognition analysis were set up. The area under the curve (AUC) was calculated to reflect the model performance. The results of machine learning were visualized by dimension reduction.
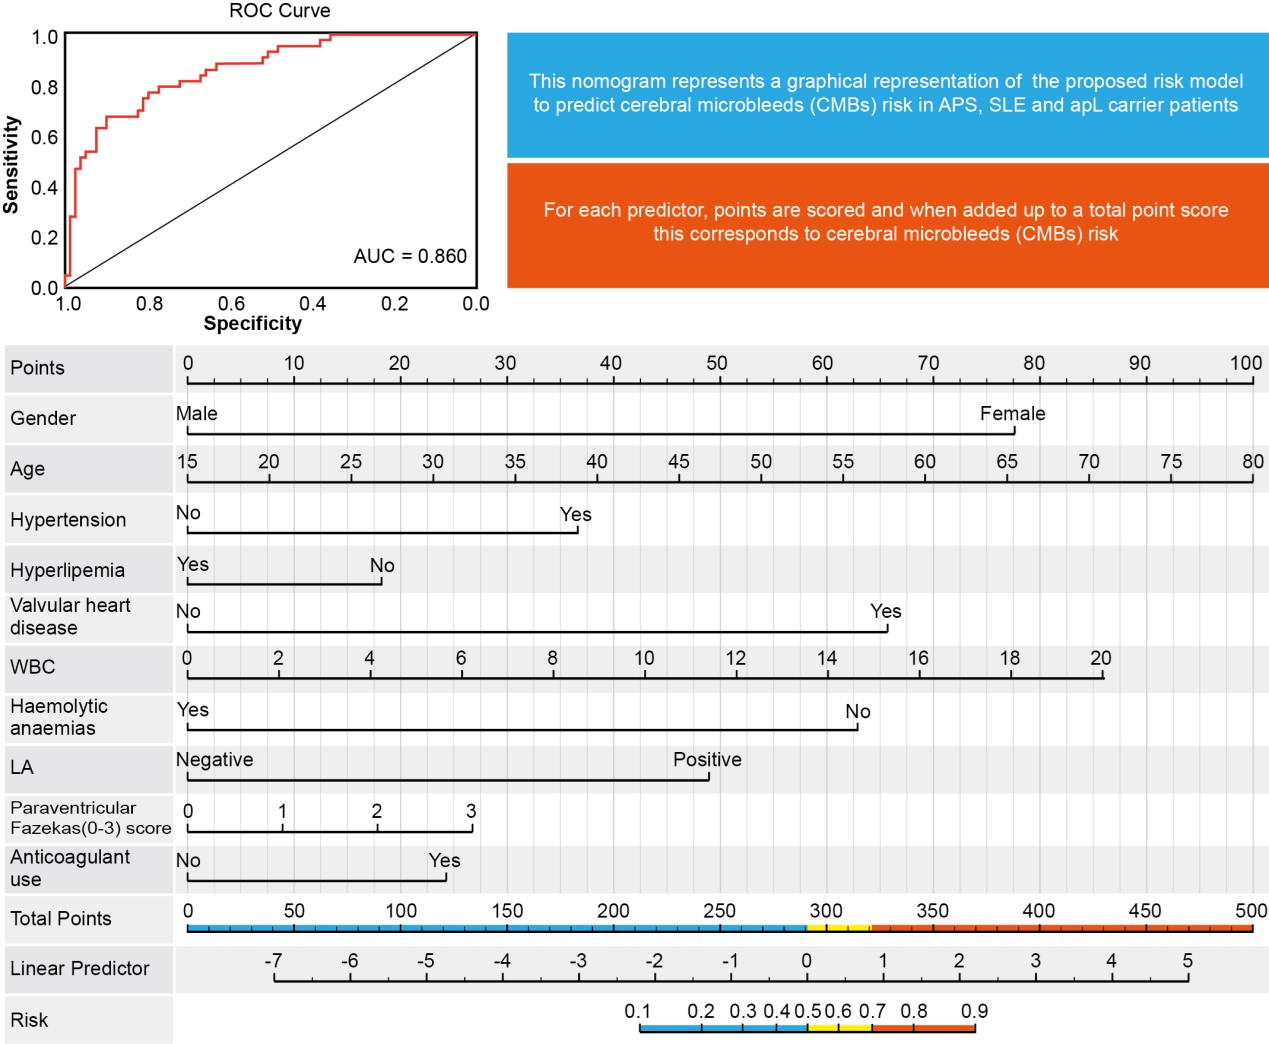
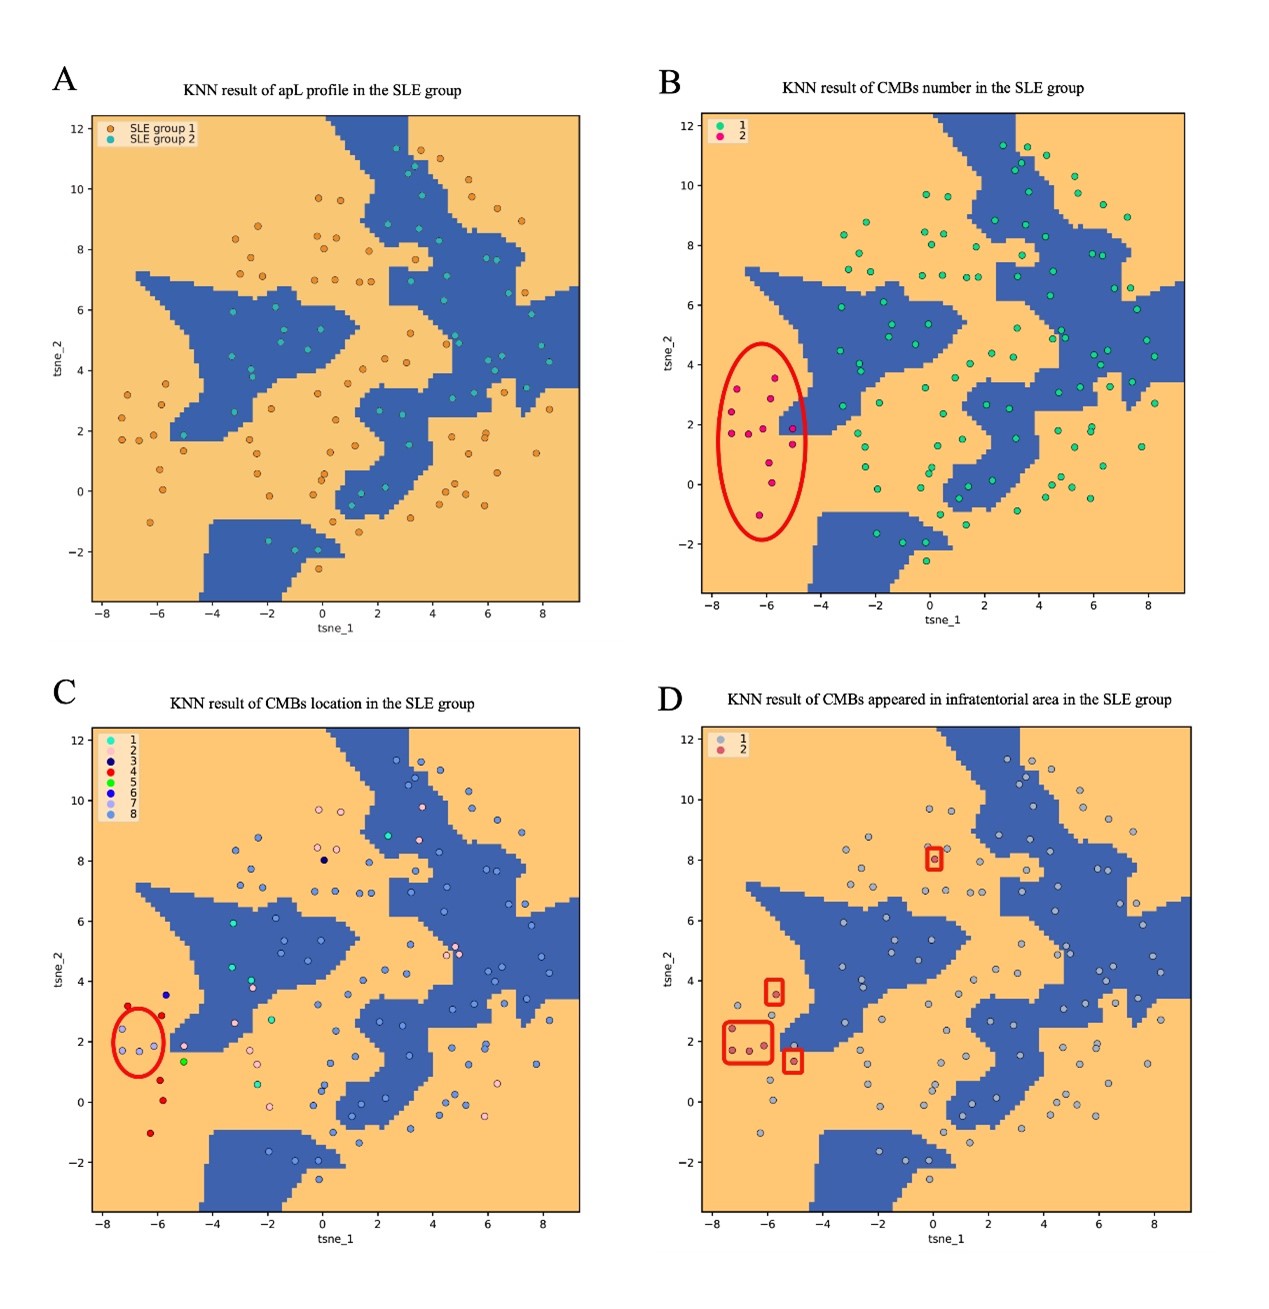
Results: Anti-cardiolipin antibody (aCL) IgG, lupus anticoagulant (LA), and apL-positive number showed a significant difference in the univariate analysis. In prediction model 1 (AUC=0.86), LA played an important role (p< 0.05, OR(95%CI): 1.31–13.24). The results of machine learning illustrated that SLE patients with positive aPLs had more CMBs numbers, more CMBs sites, and the possibility of infratentorial region hemorrhage. In addition, prediction model 2 (AUC=0.81) possessed good accuracy to predict the disease subtypes.
Conclusion: APLs were closely related to CMBs, of which LA played the most important role. It could be considered to screen CMBs by SWI in aPLs-positive patients.
Workflow and analytical plans of this study. First, the study subjects were divided into CMBs group and no-CMBs group. A univariate analysis was conducted to identify the different variables between the two groups. Further binomial logistic regression analysis was performed to explore the risk factors correlated with CMBs, and prediction model 1 was built to predict the probability of CMBs occurrence based on the risk factors. Second, we investigated the correlation between aPLs and CMBs in SLE patients using machine learning. Finally, image recognition analysis was conducted to build prediction model 2 to predict the disease type by algorithm-based integration of the location and number of CMBs.
ROC curve and nomogram representation of the binomial logistic regression analysis for CMBs risk. In the ROC curve, the X-axis presents the specificity, and the Y-axis presents the sensitivity. The area under the curve (AUC) was 0.86. In the nomogram figure, for each predictor, points are scored and then added up to a total point score, which indicated to CMBs risk. Abbreviations: CMBs: Cerebral microbleeds; ROC: Receiver operating characteristic curve; AUC: Area under the curve; LA: Lupus anticoagulant.
Results of KNN (K-Nearest Neighbor) classification analysis in all the SLE patients. (A) showed that SLE patients were divided into SLE group 1 (including SAPS and SLE patients with positive aPLs) and SLE group 2 (SLE patients without aPLs). Orange dots represented SLE group 1, orange area represents the positive aPLs area, blue dots represented SLE group 2, blue area represents the negative aPLs area. (B) showed the corresponding loci classified according to total CMBs (CMBs total level count from three locations) label. Red dots represented CMBs total number>=2; green dots represented CMBs total number<2. Orange area represents the positive aPLs area, blue area represents the negative aPLs area. Next, the corresponding loci was classified according to the bleeding site of the CMBs. Next, the corresponding loci was classified according to the bleeding site of the CMBs (C). Classification labels: 1=deep area, 2=brain lobes, 3=infratentorial region, 4=both deep area and brain lobes, 5=both deep area and infratentorial region, 6=both brain lobes and infratentorial region, 7=triple places, 8=none of these places. Orange area represented the positive aPLs area; blue area represented the negative aPLs area. (D) demonstrated a separate assessment of the infratentorial region. Orange area represented the positive apLs area; blue area represented the negative apLs area; pink dots represented the patient with CMBs appearing in the infratentorial region; grey dots represented the patient without CMBs appearing in the infratentorial region. Abbreviations: KNN: K-Nearest Neighbor; SLE: Systemic lupus erythematosus; aPLs: Antiphospholipid antibodies: SAPS: Secondary antiphospholipid syndrome; CMBs: Cerebral microbleeds.
J. Ye: None; Y. You: None; Z. Zhou: None; F. wang: None; J. Wu: None; C. Yang: None.