kevin cunningham1, Jaeyun Sung2, Benjamin Hur2, VINOD GUPTA2, Matthew Koster2, Cornelia M. Weyand3, David Cuthbertson4, Nader Khalidi5, Curry Koening6, Carol Langford7, Carol McAlear8, Paul Monach9, Larry Moreland10, Christian Pagnoux11, Rennie Rhee8, Philip Seo12, Peter Merkel8 and Kenneth Warrington2, 1University of Minnesota, Minneapolis, MN, 2Mayo Clinic, Rochester, MN, 3Mayo Clinic School of Medicine and Stanford University, Rochester, MN, 4University of South Florida, Tampa, FL, 5McMaster University, Hamilton, ON, Canada, 6University of Texas Dell Medical School, Austin, TX, 7Cleveland Clinic, Cleveland, OH, 8University of Pennsylvania, Philadelphia, PA, 9VA Boston Healthcare System, Boston, MA, 10University of Colorado, Denver, CO, 11Mount Sinai Hospital, Toronto, ON, Canada, 12Johns Hopkins University, Baltimore, MD
Background/Purpose: The availability of diagnostic laboratory tests and specific biomarkers of disease activity for giant cell arteritis (GCA) remains an area of unmet need. The purpose of this study was to utilize a high-throughput screening array to identify plasma proteins that 1) differentiate patients with GCA from controls; and 2) associate with disease activity in GCA.
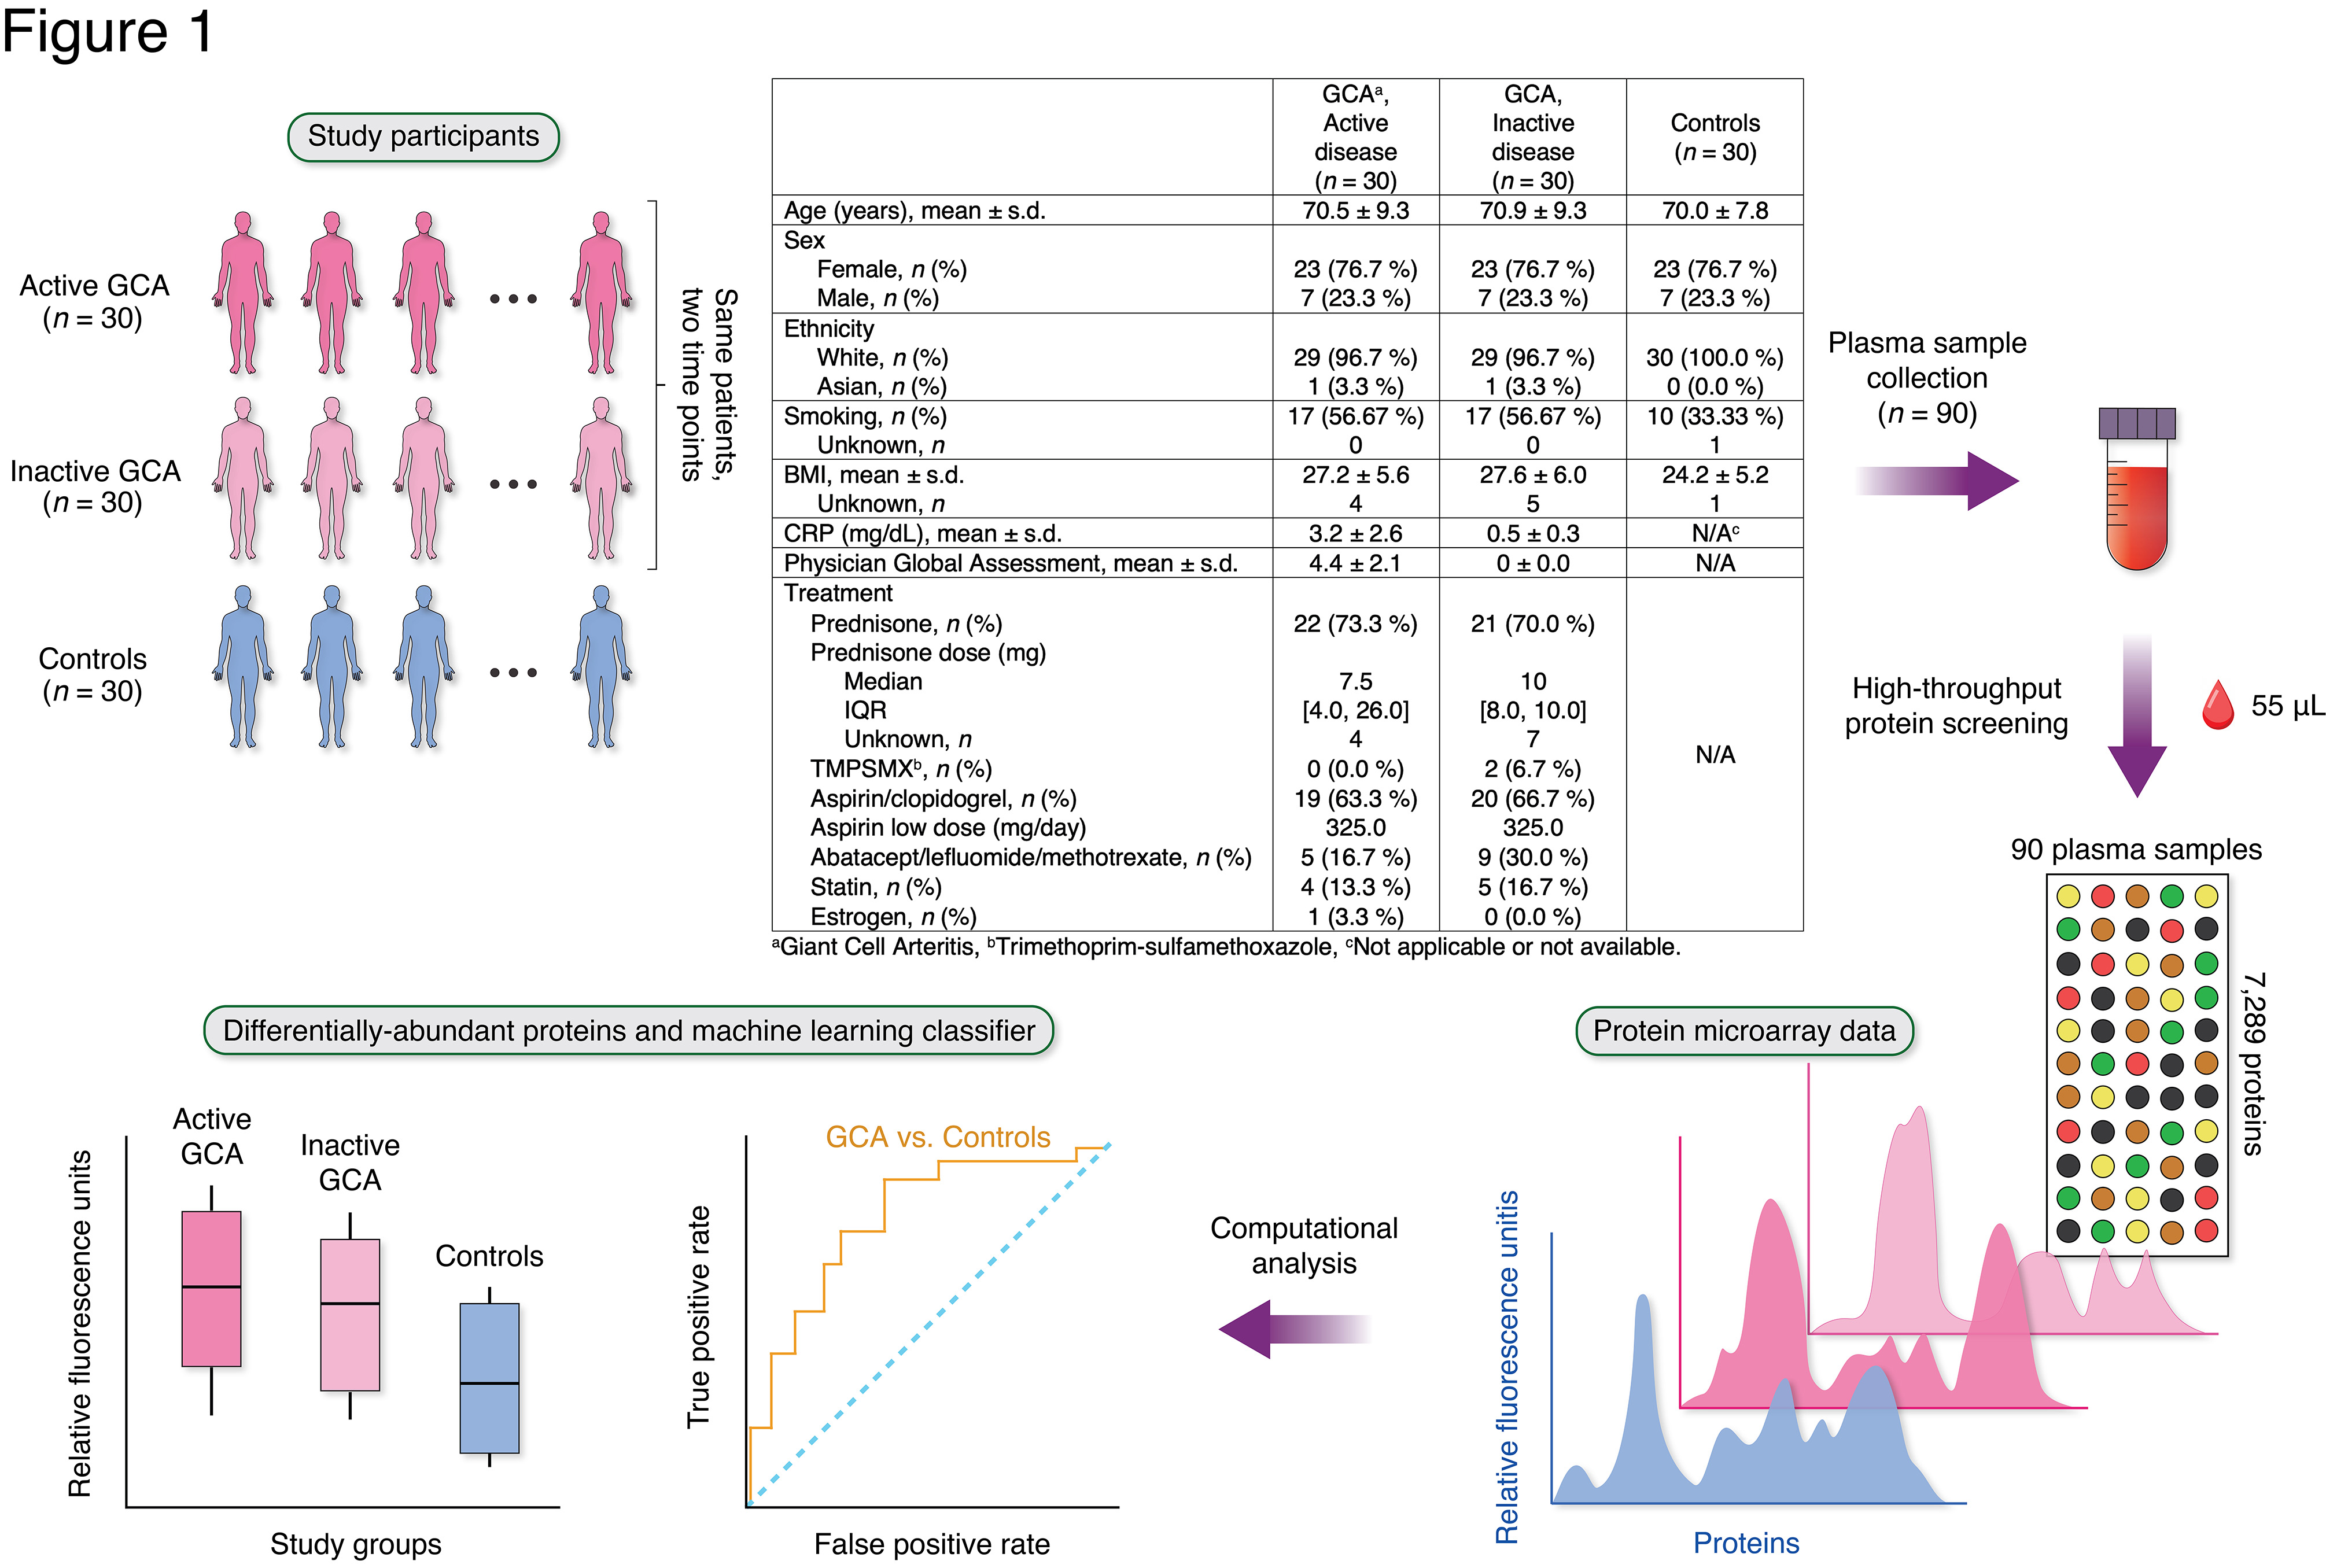
Methods: This study included patients with GCA (n = 30) from a multi-institutional prospective longitudinal cohort study and 30 age-/sex-/race-matched healthy controls (Figure 1). Most patients with GCA were taking glucocorticoids at the time of sample collection (Figure 1). Plasma samples were collected from patients with GCA at two separate visits: 1) during active disease; and 2) during inactive disease. An aptamer-based, multiplex microarray platform (SomaScan® Assay, SomaLogic) measured semi-quantitative abundances of 7,289 proteins in relative fluorescence units (RFUs). Linear regression models identified differentially-abundant proteins between patients with GCA (at active or inactive disease state) compared with controls while adjusting for potential confounders (P < 0.01). Gene Ontology (GO) Biological Processes identified enriched functional categories of the differentially-abundant proteins. Proteins associated with disease activity (Physician Global Assessment, PGA) in patients with active GCA were also identified. A random forest model was trained on plasma proteomes to develop a classifier that distinguishes GCA (active or inactive state) from controls.
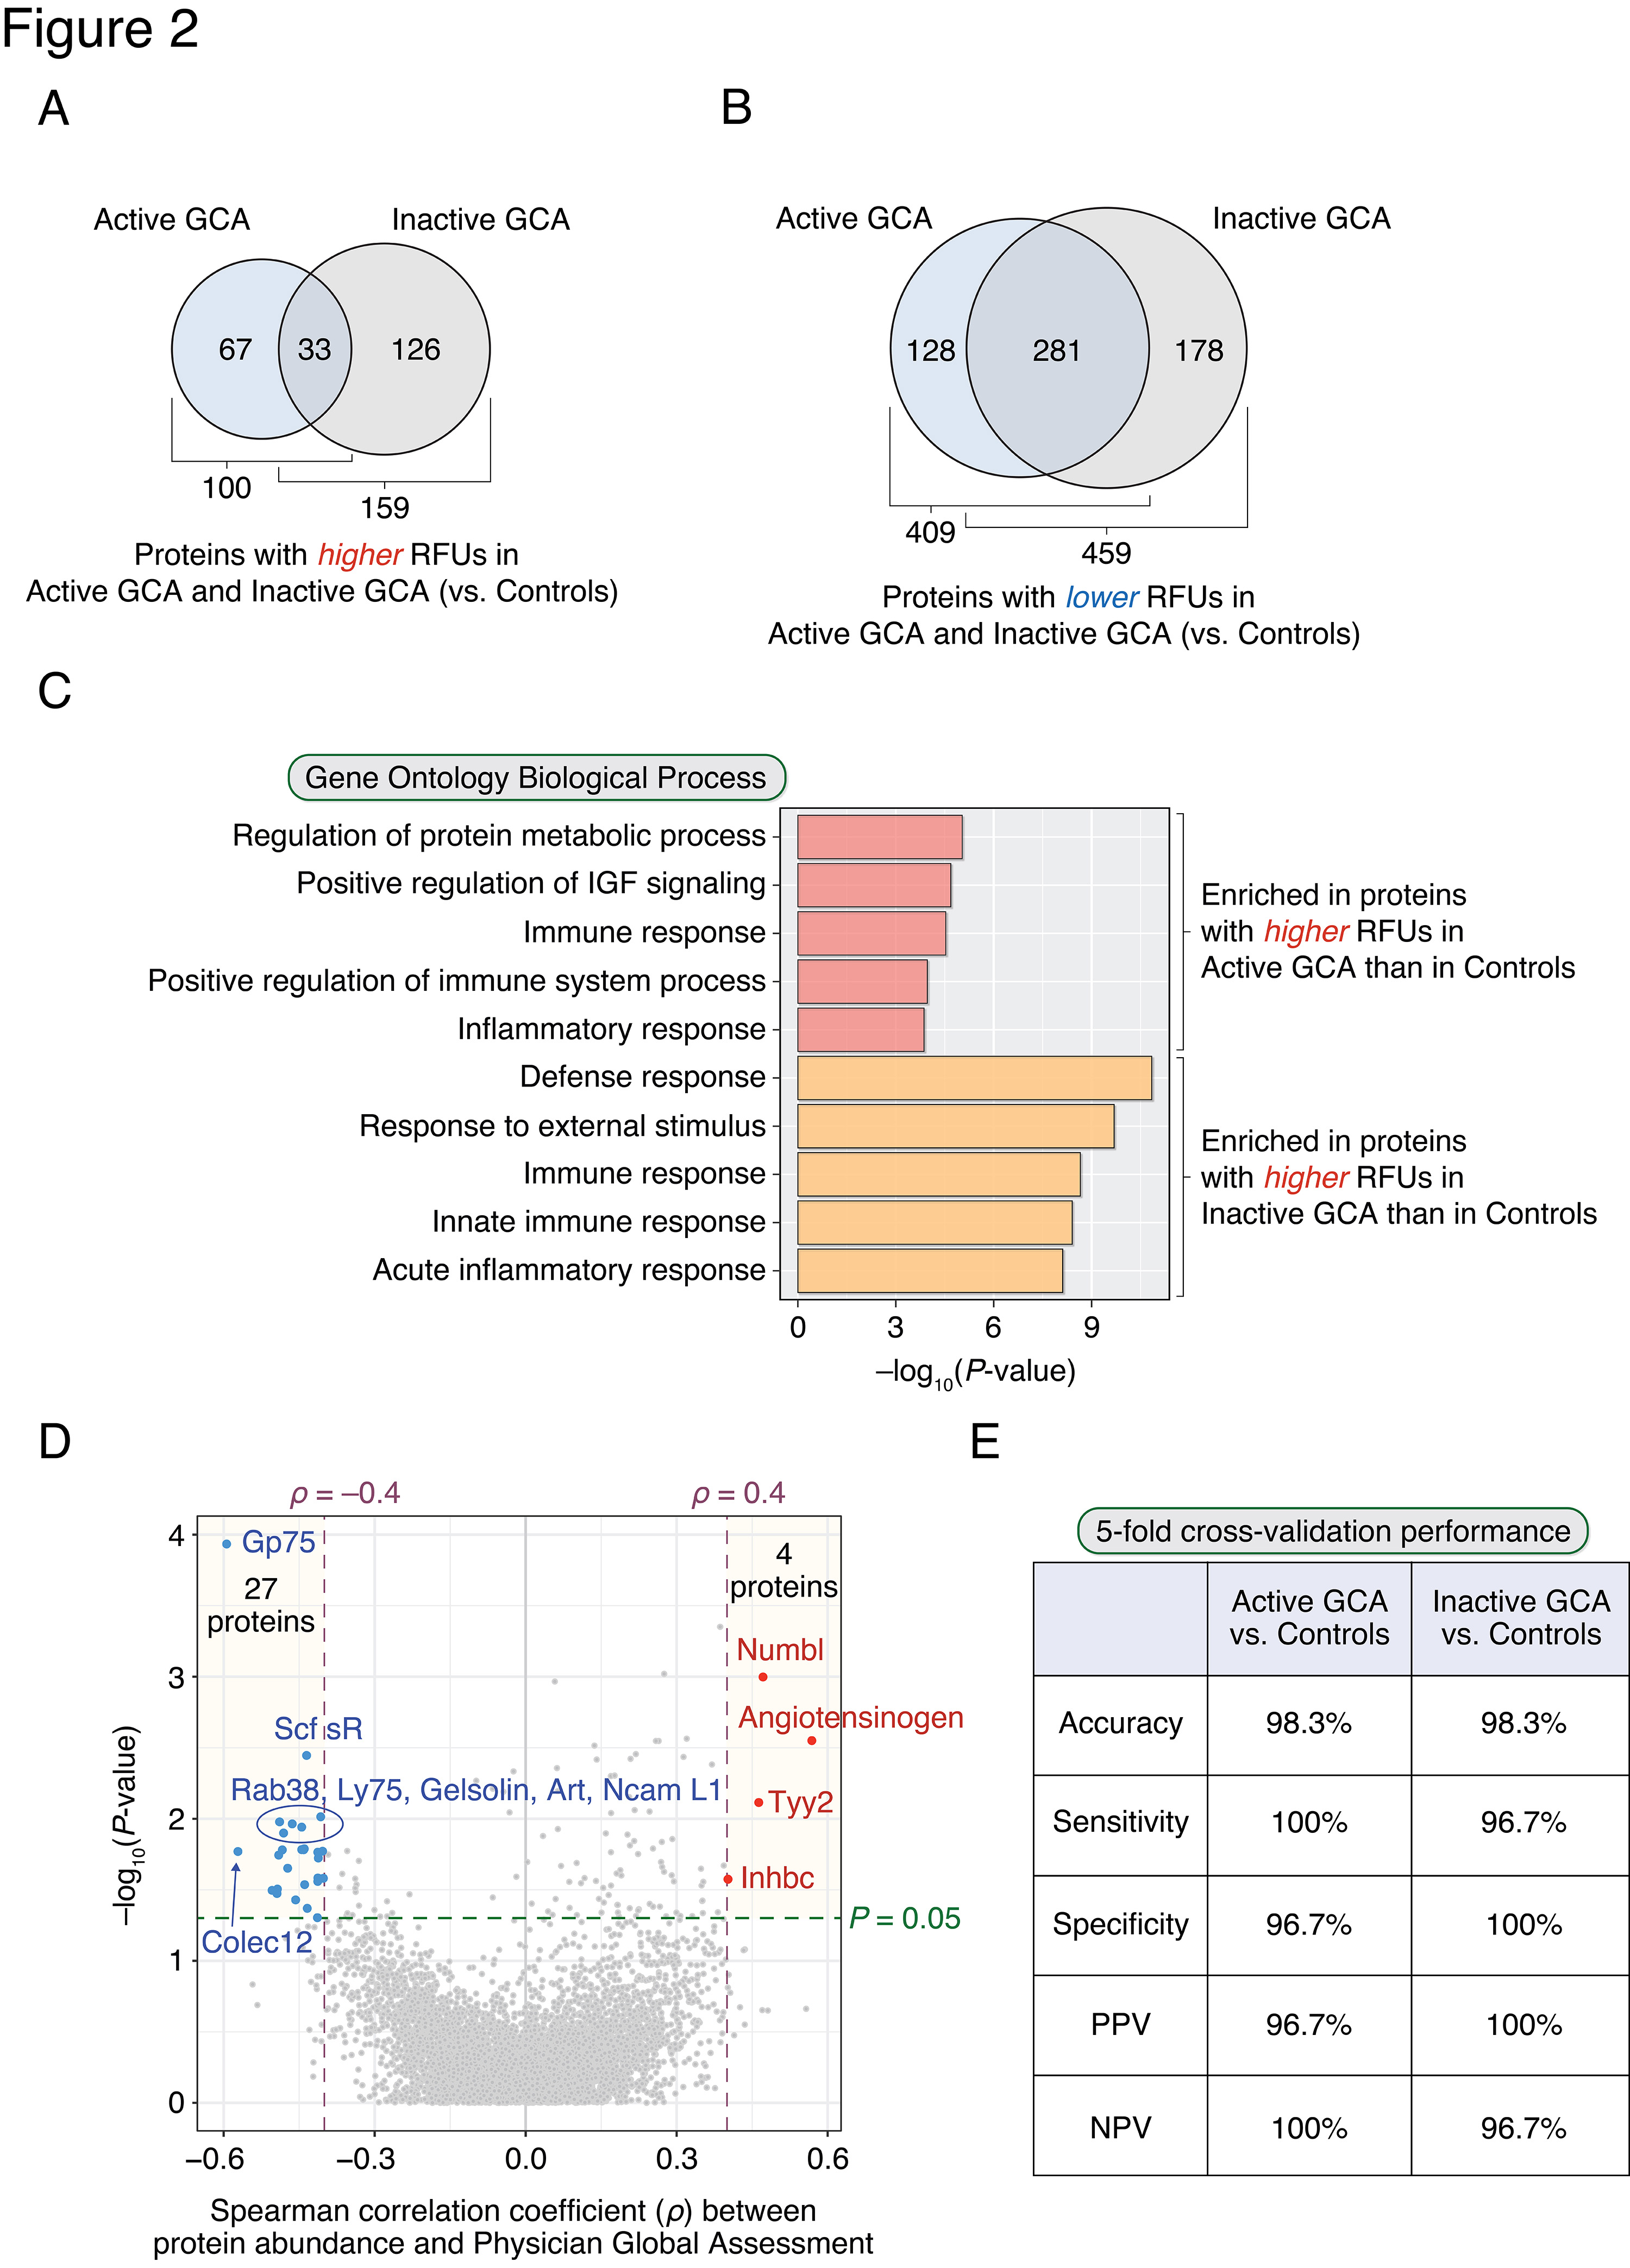
Results: 509 and 618 differentially-abundant proteins were identified between active GCA compared with healthy controls (Figure 2A) and inactive GCA compared with controls (Figure 2B), respectively. Among these, 100 and 159 proteins had significantly higher abundances in active GCA and inactive GCA, respectively. The observed enriched biological processes are shown in Figure 2C: 'Regulation of protein metabolic process' and immune-related processes were the most highly enriched functions of plasma proteins found higher in active GCA. Interestingly, processes involving apoptosis, nucleotide metabolism, and EGFR, ErbB, and neurotrophin signaling were also significantly enriched. A paired analysis between active and inactive visits found 219 differentially abundant proteins. In addition, 31 proteins were found to be associated with disease activity (PGA) in patients with active GCA (Figure 2D). A random forest classifier correctly predicted active GCA vs. controls with an accuracy of 98.3% (sensitivity: 100%; specificity: 96.7%) in 5-fold cross-validation (Figure 2E). Similarly, in the case of inactive GCA vs. controls, a random forest classifier distinguished these two phenotypes at 98.3% accuracy (sensitivity: 96.7%; specificity: 100%).
Conclusion: Plasma proteome profiling in two different disease states of GCA produced highly accurate classification for distinguishing active and inactive disease states from controls. These results demonstrate the strong potential of integrating plasma proteomes with machine learning for future approaches to identify GCA. Future studies should include validating these findings in a larger independent cohort.
Figure 1. Study design overview. Plasma samples were collected from 30 patients with GCA and 30 healthy controls. For each patient with GCA, one sample was collected at a time of active disease (physician global assessment [PGA] > 0) and another at a time of inactive disease (PGA = 0). Proteome profiling was performed on all samples using an aptamer-based, multiplex microarray platform. Proteins were compared between patients with GCA and controls to identify differentially-abundant proteins and enriched biological functions. The confounding factors adjusted for during linear regression modeling were age, sex, smoking status, and use of prednisone, aspirin, and methotrexate. A machine learning technique (random forests) was trained on the plasma proteome profiles to build a classifier that distinguishes between GCA and controls.
Figure 2. Differences in plasma proteins between patients with GCA and healthy controls form the basis of a novel machine learning approach for identifying GCA. Plasma proteins found to have significantly higher (A) or lower (B) relative fluorescence unit (RFU) abundances in active GCA and inactive GCA compared with controls (P-value of the corresponding regression coefficient < 0.01). The intersection of the Venn diagram indicates proteins having higher (or lower) RFUs in both disease states. (C) Top 5 enriched (i.e., statistically over-represented) GO Biological Processes from proteins higher in active GCA and inactive GCA compared with controls. Enriched GO terms are rank-ordered in descending order based on modified one-tailed Fisher’s exact test P-values. (D) A total of 31 proteins were significantly associated with physician’s global assessment (PGA) in active GCA (P-value < 0.05 and |Spearman’s rho| > 0.4): 4 and 27 proteins had positive and negative correlations with PGA, respectively. (E) Random forest classifiers could differentiate patients with GCA from controls with high accuracy (> 98%) in 5-fold cross-validation.
k. cunningham: None; J. Sung: None; B. Hur: None; V. GUPTA: None; M. Koster: None; C. Weyand: AbbVie/Abbott, 1, Bristol-Myers Squibb(BMS), 1, Gilead, 1; D. Cuthbertson: None; N. Khalidi: AbbVie/Abbott, 5, Bristol-Myers Squibb(BMS), 5, GlaxoSmithKlein(GSK), 1, Otsuka, 1, 6, Roche, 1, 6; C. Koening: Amgen, 1; C. Langford: AbbVie, 12, Non-paid consultant, AstraZeneca, 5, 12, Non-paid consultant, Bristol-Myers Squibb(BMS), 5, 12, Non-paid consultant, GlaxoSmithKlein(GSK), 5; C. McAlear: None; P. Monach: Genentech, 12, Lecture with honorarium, HI-Bio, 2; L. Moreland: Boehringer-Ingelheim, 12, member of independent Data Safety Monitoring Board, Celltrion, 12, member of independent Data Safety Monitoring Board; C. Pagnoux: AstraZeneca, 1, 2, 6, GlaxoSmithKlein(GSK), 1, 6, Otsuka, 1, 2, 5, 6, Pfizer, 5, Roche, 2; R. Rhee: None; P. Seo: Amgen, 1, Janssen, 1; P. Merkel: AbbVie/Abbott, 5, Amgen, 2, 5, ArGenx, 2, AstraZeneca, 2, 5, Boehringer-Ingelheim, 2, 5, Bristol-Myers Squibb(BMS), 2, 5, Cabaletta, 2, CSL Behring, 2, Eicos, 5, Electra, 5, Genentech, 5, GlaxoSmithKlein(GSK), 2, 5, HiBio, 2, InflaRx, 2, 5, Janssen, 2, Jubilant, 2, Kyverna, 2, 11, MiroBio, 2, Neutrolis, 5, Novartis, 2, NS Pharma, 2, Q32, 2, Regeneron, 2, Sanofi, 2, Sparrow, 2, Takeda, 2, 5, UpToDate, 9, Visterra, 2; K. Warrington: Bristol-Myers Squibb(BMS), 5, Chemocentryx, 1, 6, Eli Lilly, 5, kiniksa, 5.