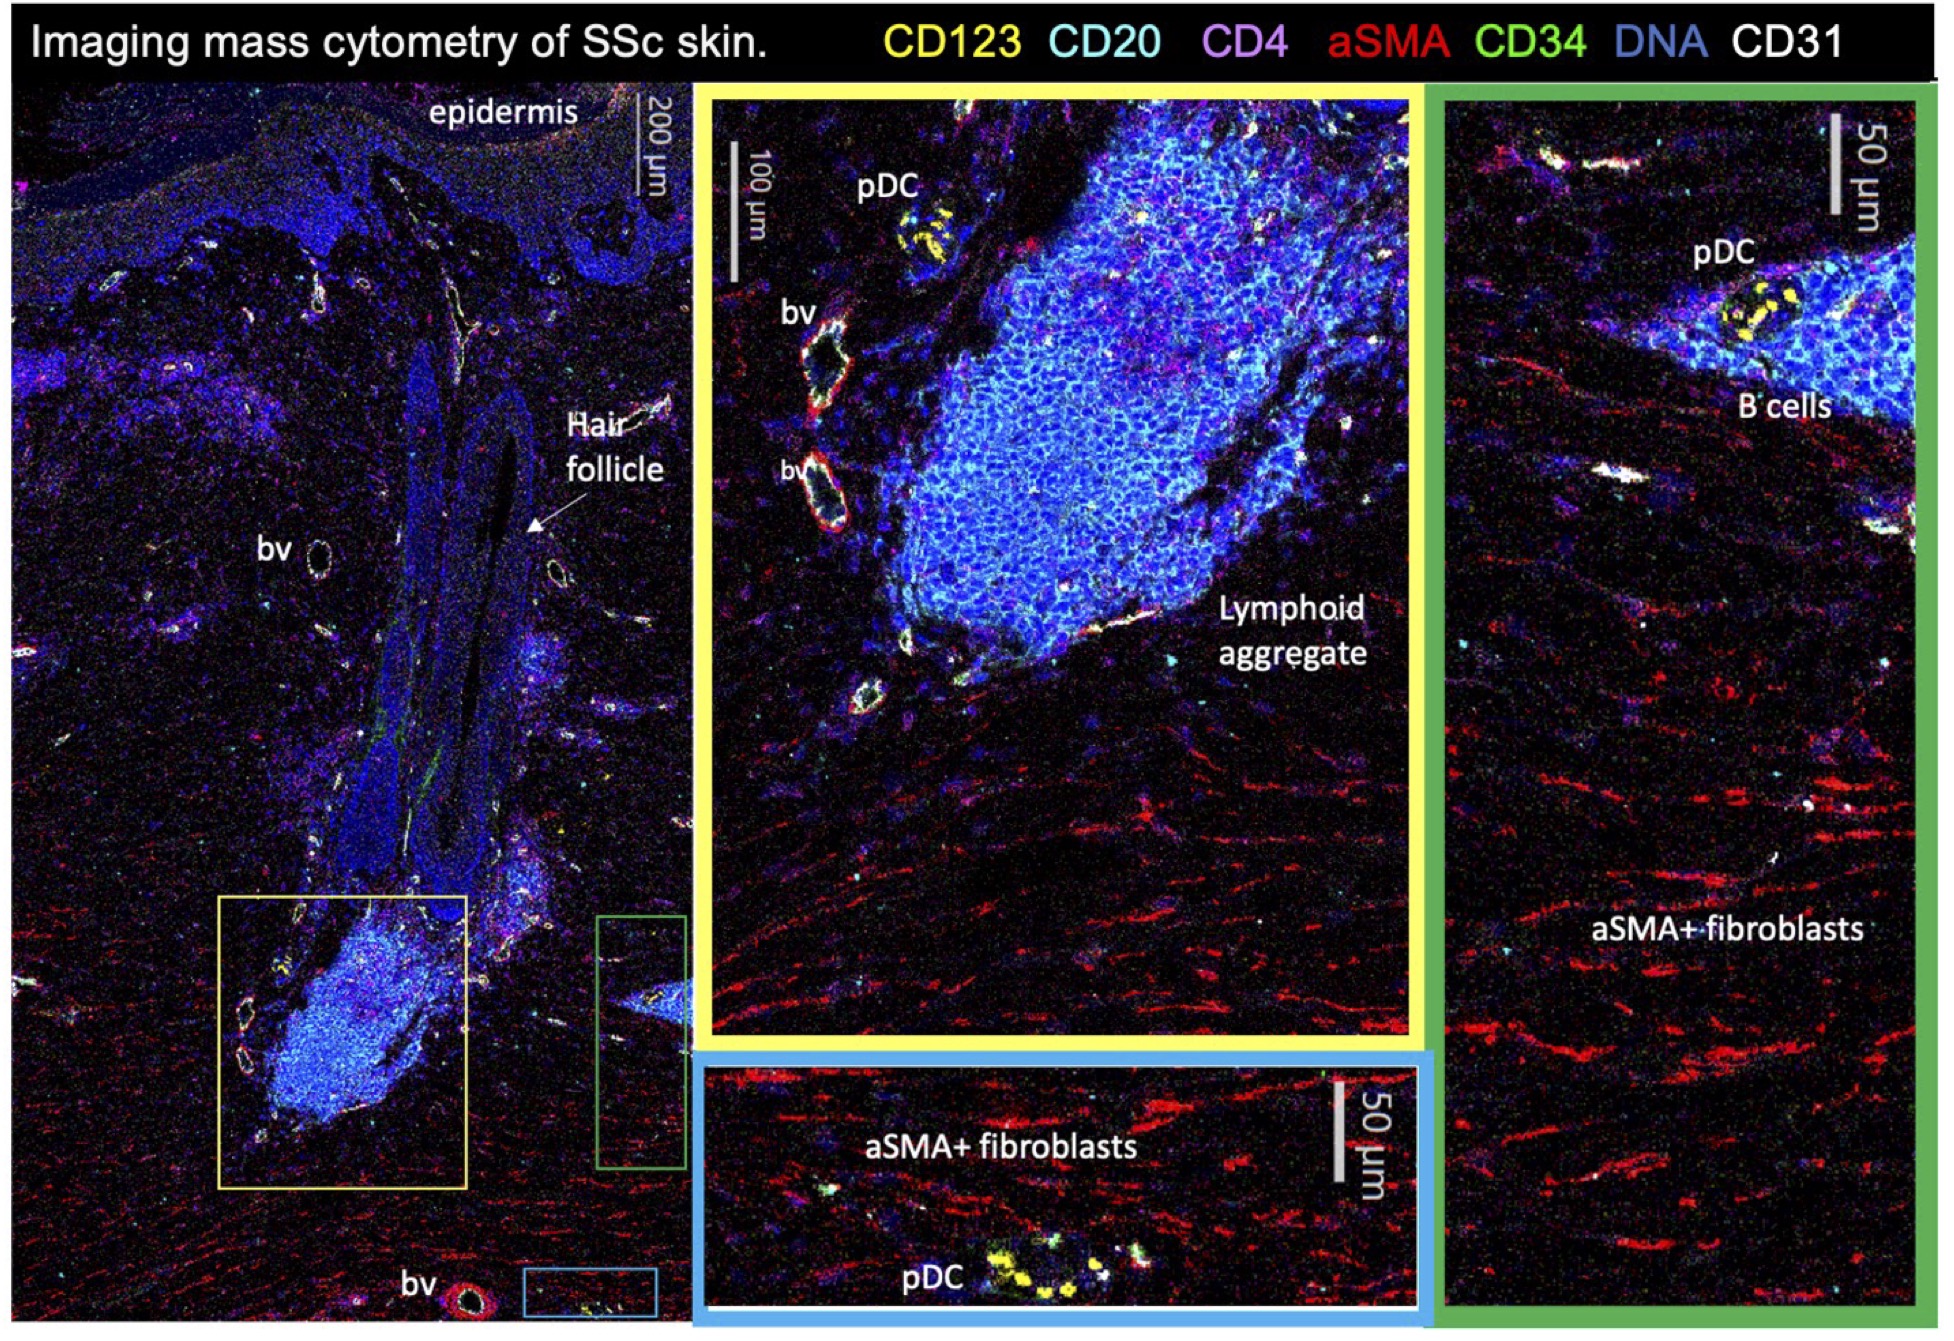
The Rockefeller University New York, NY, United States
Disclosure information not submitted.
Kimberly Lakin1, Robert Spiera2, Yaxia Zhang1, David Oliver1, Aliza Bloostein1, Hiranmayi Ravichandran3, Niroshana Anandasabapathy3, Franck Barrat1, Jessica Gordon1 and Dana Orange4, 1Hospital for Special Surgery, New York, NY, 2Hosptial for Special Surgery, New York, NY, 3Weill Cornell Medical College, New York, NY, 4The Rockefeller University, New York, NY
Background/Purpose: We have previously shown that skin fibroblast activation is related to clinical severity and resolves with improvement in diffuse systemic sclerosis (dcSSc). The immune cells that associate with fibroblast activation are not fully characterized. The purpose of this study was to evaluate associations between immune cells and fibroblasts of varying stages of activation in dcSSc skin.
Methods: Histology of 137 forearm skin biopsies from 105 dcSSc patients were scored for fibroblast markers (CD34, alpha smooth muscle actin (aSMA); semiquantitative), and immune cells (B cells (CD20+), T cells (CD3+) and plasmacytoid dendritic cells (pDCs; CD123+); count per 5 HPF). 79 samples were also stained for MxA, a type 1 interferon (IFN)-related protein, scored present or absent. Non-inflammatory fibroblast pattern was defined by CD34high/aSMAlow scores. Inflammatory fibroblast pattern was defined as aSMAhigh and/or CD34low scores. Clinical variables and cell counts were compared between fibroblast immunophenotypes using Fisher's exact, t-test, or Wilcoxon rank-sum. Spearman correlation was used to assess the association between histologic features. Imaging mass cytometry (IMC) was used to visualize immune-stromal cell spatial interactions. Gene expression was analyzed by microarray for all samples. GSEA was performed using hallmark gene sets between fibroblast groups. Average expression of genes in selected pathways were ranked, and a loess curve was fit to each fibroblast group (bands represent 0.99 confidence interval).
Results: Inflammatory (vs. non-inflammatory) fibroblast samples (66 of 137, 48%) had worse clinical severity (modified Rodnan skin score (p< 0.001), HAQ (p=0.012), Patient Global (p=0.036) and Physician Global (p< 0.001)) (Table 1A) and higher median CD20+ (p< 0.001), CD3+ (p=0.003) and CD123+ cell count (p=0.028) (Table 1B). CD34 (key marker of non-inflammatory fibroblasts) correlated negatively with CD20 (rs=-0.315, p=0.0002), CD123 (rs=-0.281, p=0.0009), and CD3 (rs=-0.236, p=0.0058), while aSMA (key marker of inflammatory fibroblasts) correlated positively with CD20 (rs=0.415, p< 0.00001) and CD3 (rs=0.212, p=0.0135). Samples with detectable MxA protein expression had higher median CD123+ cells (5 vs. 1, p=0.001). IMC in a representative sample revealed infiltrating pDC adjacent to B cells and local interactions between these cells and aSMA+ fibroblasts (Fig. 1). Gene expression analysis demonstrated upregulation of IFN-alpha, TGF-beta, and inflammatory response as well as epithelial-mesenchymal transition among samples with inflammatory vs. non-inflammatory fibroblasts (Fig. 2).
Conclusion: Inflammatory fibroblasts in clinically severe SSc skin are associated with hallmark inflammatory response, IFN-alpha response, and TGF-beta signaling, as well as T cell, B cell, and pDC infiltration. Inflammatory fibroblasts are physically associated with B cells and pDCs in SSc skin. These data are relevant to SSc trials targeting B cell and IFN pathways. To our knowledge, this is the first report using IMC to visualize immune-stromal cell spatial interactions in dcSSc skin. Future work quantifying IMC data will further characterize these associations in a larger sample.
Figure 1. The use of imaging mass cytometry (Hyperion) to visualize pDCs, B cell, T cells, and fibroblasts in the skin of an individual with early, severe diffuse systemic sclerosis (modified Rodnan skin score (MRSS) 32, local (biopsy-site) MRSS 3).
Figure 2. Genes related to interferon-alpha response, TGF-beta signaling, and hallmark inflammatory response as well as epithelial-mesenchymal transition are upregulated among samples characterized by inflammatory versus non-inflammatory fibroblasts. (Left Panel) Gene Set Enrichment Analysis for selected pathways according to fibroblast group. (Center Panel) Average expression of individual genes included in each pathway according to inflammatory vs. non-inflammatory fibroblast samples. (Right Panel) Volcano plot of relevant genes between inflammatory vs. non-inflammatory fibroblast samples.
K. Lakin: None; R. Spiera: AbbVie/Abbott, 2, 5, Amgen, 2, AstraZeneca, 5, chemocentryx, 5, corbus, 5, Formation Biologics, 5, GSK, 2, 5, Inflarx, 5, Kadmon, 5, Novartis, 2, 5, Principia, 5, Sanofi, 2; Y. Zhang: None; D. Oliver: None; A. Bloostein: None; H. Ravichandran: None; N. Anandasabapathy: 23&me, 2, Immunitas, 2, Janssen, 1, Leo pharma, 1, Shennon Pharma, 1; F. Barrat: AstraZeneca, 2, Boehringer-Ingelheim, 2, Colton Center - NYU, 1, IpiNovyx Bio, 2, 5, 8, 10; J. Gordon: Cumberland Pharmaceuticals, 5, Prometheus Pharmaceuticals, 5; D. Orange: AstraZeneca, 2, Pfizer, 2.